Northcentral University total enrollment is approximately 12,471 students. 55 are undergraduates and 4,913 are graduate students.
Male/Female Breakdown of Undergraduates
The full-time Northcentral University undergraduate population is made up of 84% women, and 16% men.
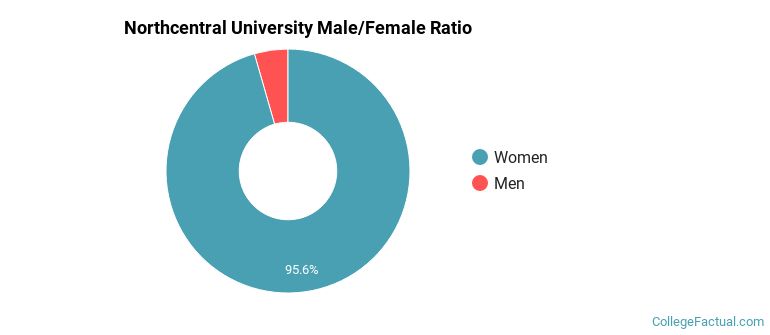
For the gender breakdown for all students, go here.
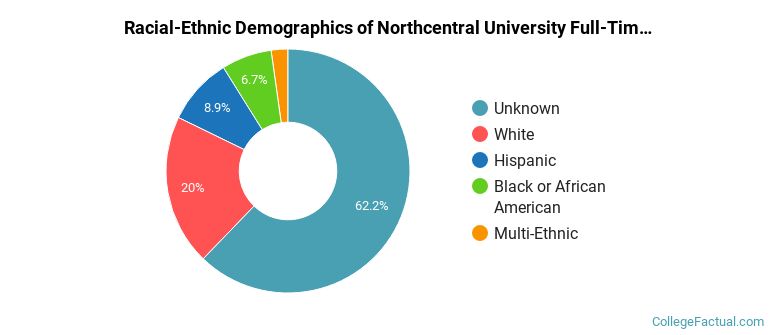
Northcentral University Racial/Ethnic Breakdown of Undergraduates
| Race/Ethnicity | Number |
|---|---|
| Unknown | 38 |
| White | 9 |
| Black or African American | 4 |
| Hispanic | 2 |
| Asian | 1 |
| Native Hawaiian or Pacific Islander | 1 |
| International | 0 |
| Multi-Ethnic | 0 |
See racial/ethnic breakdown for all students.
Male/Female Breakdown of Graduate Students
About 71% of full-time grad students are women, and 29% men.
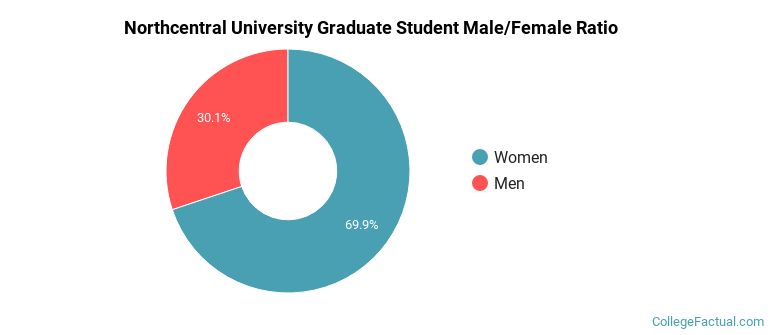
For the gender breakdown for all students, go here.
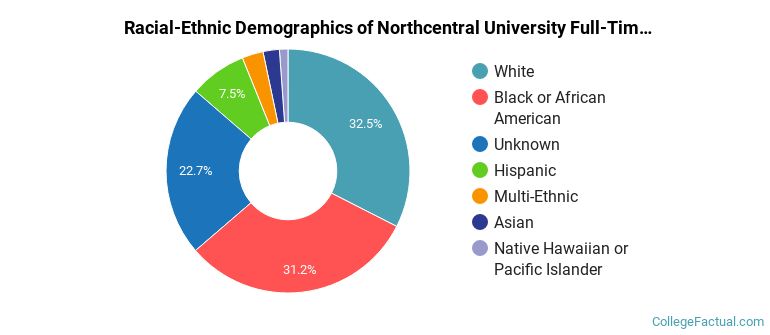
Northcentral University Racial-Ethnic Breakdown of Graduate Students
| Race/Ethnicity | Number |
|---|---|
| Black or African American | 1,653 |
| White | 1,553 |
| Unknown | 927 |
| Hispanic | 415 |
| Multi-Ethnic | 150 |
| Asian | 122 |
| Native Hawaiian or Pacific Islander | 53 |
| International | 0 |
See racial/ethnic breakdown for all students.

| Race/Ethnicity | Number |
|---|---|
| Black or African American | 4,458 |
| White | 3,995 |
| Unknown | 1,852 |
| Hispanic | 1,175 |
| Multi-Ethnic | 461 |
| Asian | 311 |
| Native Hawaiian or Pacific Islander | 111 |
| International | 0 |
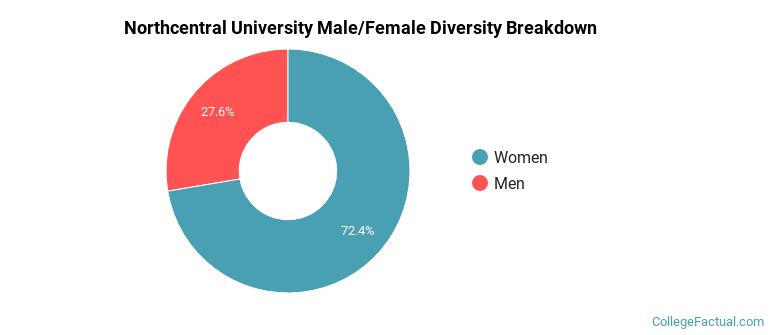
There are approximately 9,289 female students and 3,182 male students at Northcentral University.
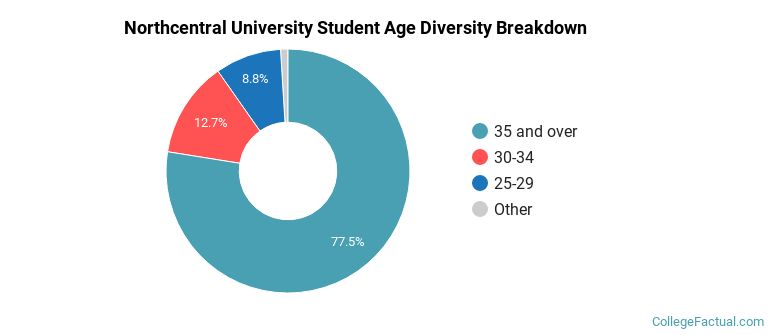
| Student Age Group | Amount |
|---|---|
| 35 and over | 7,909 |
| 30-34 | 1,299 |
| 25-29 | 894 |
| 22-24 | 100 |
| 18-19 | 0 |
| 20-21 | 0 |
| Under 18 | 0 |
Footnotes
*The racial-ethnic minorities count is calculated by taking the total number of students and subtracting white students, international students, and students whose race/ethnicity was unknown. This number is then divided by the total number of students at the school to obtain the racial-ethnic minorities percentage.
References