Explore the best ranked schools for the programs you are most interested in.
NICC is ranked #1,851 out of 2,152 schools in the nation for overall quality on College Factual's 2025 Best Colleges list.
See all of the rankings for Northeast Iowa Community College.
If you are worried about getting into Northeast Iowa Community College, don't be. The school has a liberal open admissions policy, which means you only need to meet basic requirements in order to be admitted. Still, be sure to submit a complete application and provide any other requested materials.
With a student to faculty ratio of 15 to 1, Northeast Iowa Community College is about average in this regard as the nationwide rate is 15 to 1. While this does not translate directly to class size, it's a good indicator of how much time professors will have to spend with their students on a one-on-one basis.
When estimating how much access students will have to their teachers, some people like to look at what percentage of faculty members are full time. This is because part-time teachers may not have as much time to spend on campus as their full-time counterparts.
The full-time faculty percentage at Northeast Iowa Community College is 44%. This is comparable to the national average of 47%.
The freshmen retention rate is a sign of how many full-time students like a college or university well enough to come back for their sophomore year. At Northeast Iowa Community College this rate is 53%, which is a bit lower than the national average of 68%.
During the 2017-2018 academic year, there were 4,162 undergraduates at NICC with 1,036 being full-time and 3,126 being part-time.
| $0-30 K | $30K-48K | $48-75 | $75-110K | $110K + |
|---|---|---|---|---|
| $6,417 | $5,737 | $8,640 | $11,175 | $12,361 |
The net price is calculated by adding tuition, room, board and other costs and subtracting financial aid.Note that the net price is typically less than the published for a school. For more information on the sticker price of NICC, see our tuition and fees and room and board pages.
While almost two-thirds of students nationwide take out loans to pay for college, the percentage may be quite different for the school you plan on attending. At NICC, approximately 28% of students took out student loans averaging $4,772 a year. That adds up to $19,088 over four years for those students.
Get more details about paying for Northeast Iowa Community College.
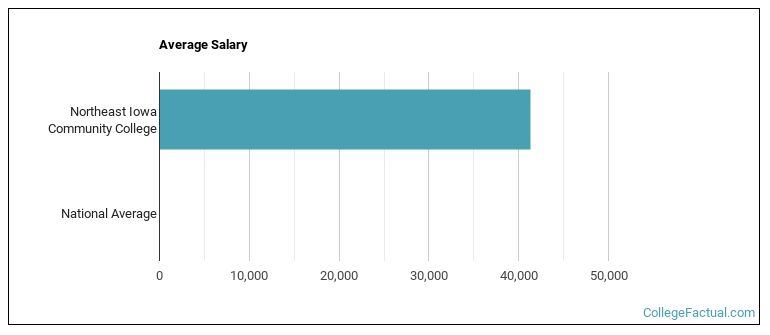
See which majors at Northeast Iowa Community College make the most money.
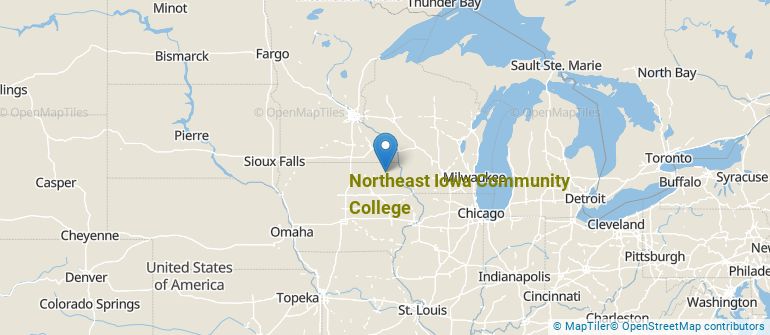
Get more details about the location of Northeast Iowa Community College.
Contact details for NICC are given below.
| Contact Details | |
|---|---|
| Address: | 1625 Hwy 150, Calmar, IA 52132-0400 |
| Phone: | 844-642-2338 |
| Website: | https://www.nicc.edu/ |
| Most Popular Majors | Bachelor’s Degrees | Average Salary of Graduates |
|---|---|---|
| Liberal Arts General Studies | 114 | NA |
| Nursing | 93 | NA |
| Practical Nursing & Nursing Assistants | 72 | NA |
| Allied Health Professions | 30 | NA |
| Business Administration & Management | 28 | NA |
| Agricultural Mechanization | 26 | NA |
| Precision Metal Working | 23 | NA |
| Vehicle Maintenance & Repair | 22 | NA |
| Electrical & Power Transmission Installers | 20 | NA |
| Human Development & Family Studies | 20 | NA |
Online courses area a great option for busy, working students as well as for those who have scheduling conflicts and want to study on their own time. As time goes by, expect to see more and more online learning options become available.
In 2022-2023, 1,849 students took at least one online class at Northeast Iowa Community College. This is an increase from the 1,711 students who took online classes the previous year.
| Year | Took at Least One Online Class | Took All Classes Online |
|---|---|---|
| 2022-2023 | 1,849 | 906 |
| 2021-2022 | 1,711 | 875 |
| 2020-2021 | 2,307 | 969 |
| 2018-2019 | 1,752 | 498 |
Learn more about online learning at Northeast Iowa Community College.
Footnotes
*The racial-ethnic minorities count is calculated by taking the total number of students and subtracting white students, international students, and students whose race/ethnicity was unknown. This number is then divided by the total number of students at the school to obtain the racial-ethnic minorities percentage.
References
More about our data sources and methodologies.