We've pulled together some essential information you should know about the program, including how many students graduate each year, the ethnic diversity of these students, and more. Also, learn how NEO A&M College ranks among other schools offering degrees in medical prep.
Jump to any of the following sections:
The bachelor's program at NEO A&M College was ranked #36 on College Factual's Best Schools for medical prep list.
During the 2022-2023 academic year, part-time undergraduate students at NEO A&M College paid an average of $370 per credit hour if they came to the school from out-of-state. In-state students paid a discounted rate of $165 per credit hour. The following table shows the average full-time tuition and fees for undergraduates.
| In State | Out of State | |
|---|---|---|
| Tuition | $3,000 | $9,150 |
| Fees | $1,943 | $1,943 |
| Books and Supplies | $1,550 | $1,550 |
| On Campus Room and Board | $7,200 | $7,200 |
| On Campus Other Expenses | $5,410 | $5,410 |
Learn more about NEO A&M College tuition and fees.
Online degrees for the NEO A&M College medical prep bachelor’s degree program are not available at this time. To see if the school offers distance learning options in other areas, visit the NEO A&M College Online Learning page.
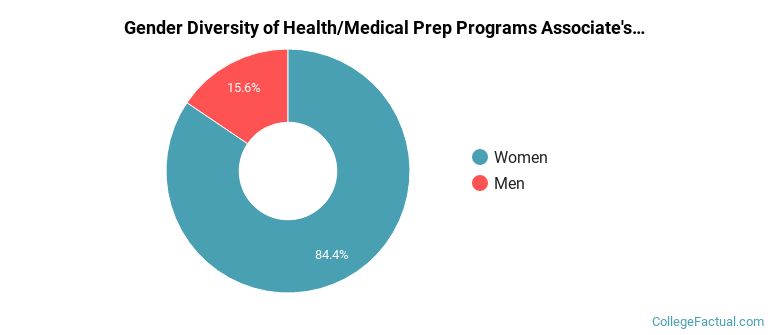
Of the 45 students who earned an associate's degree in Health/Medical Prep Programs from NEO A&M College in 2021-2022, 16% were men and 84% were women.
The majority of associate's degree recipients in this major at NEO A&M College are white. In the most recent graduating class for which data is available, 51% of students fell into this category.
The following table and chart show the ethnic background for students who recently graduated from Northeastern Oklahoma A&M College with a associate's in medical prep.
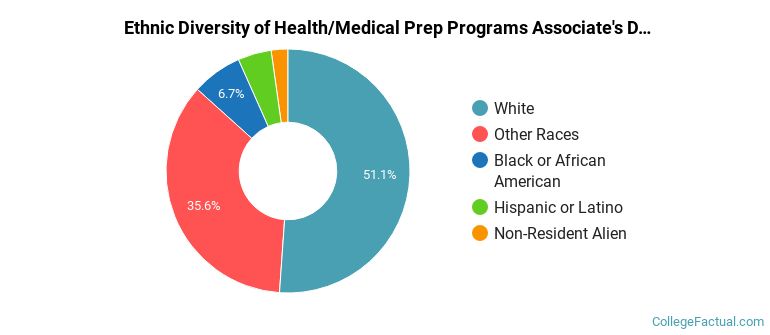
| Ethnic Background | Number of Students |
|---|---|
| Asian | 0 |
| Black or African American | 3 |
| Hispanic or Latino | 2 |
| White | 23 |
| Non-Resident Aliens | 1 |
| Other Races | 16 |
| Related Major | Annual Graduates |
|---|---|
| Nursing | 48 |
| Clinical/Medical Laboratory Science | 12 |
| Allied Health & Medical Assisting Services | 11 |