Northeastern University Professional Advancement Network total enrollment is approximately 11,310 students. 1,528 are undergraduates and 1,971 are graduate students.
Male/Female Breakdown of Undergraduates
The full-time Northeastern University Professional Advancement Network undergraduate population is made up of 61% women, and 39% men.

For the gender breakdown for all students, go here.
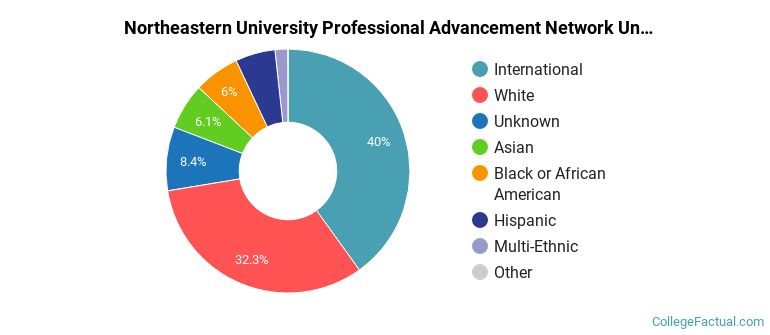
Northeastern University Professional Advancement Network Racial/Ethnic Breakdown of Undergraduates
| Race/Ethnicity | Number |
|---|---|
| White | 883 |
| Asian | 200 |
| International | 184 |
| Hispanic | 103 |
| Multi-Ethnic | 75 |
| Black or African American | 52 |
| Unknown | 31 |
| Native Hawaiian or Pacific Islander | 0 |
See racial/ethnic breakdown for all students.
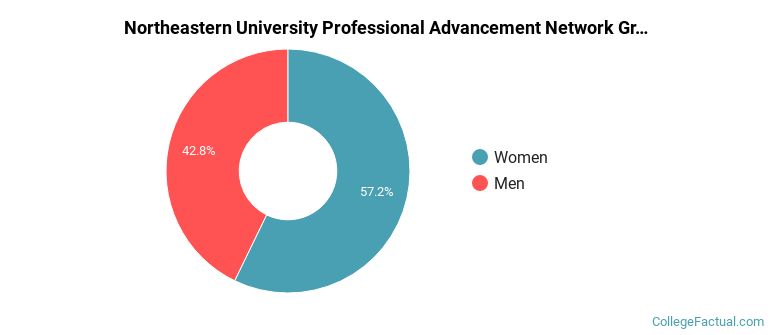
Male/Female Breakdown of Graduate Students
About 62% of full-time grad students are women, and 38% men.
For the gender breakdown for all students, go here.
Northeastern University Professional Advancement Network Racial-Ethnic Breakdown of Graduate Students
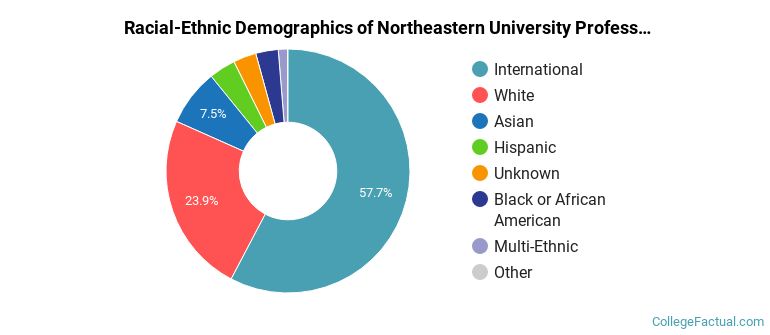
| Race/Ethnicity | Number |
|---|---|
| International | 1,093 |
| White | 448 |
| Asian | 190 |
| Black or African American | 77 |
| Hispanic | 77 |
| Unknown | 53 |
| Multi-Ethnic | 33 |
| Native Hawaiian or Pacific Islander | 0 |
See racial/ethnic breakdown for all students.
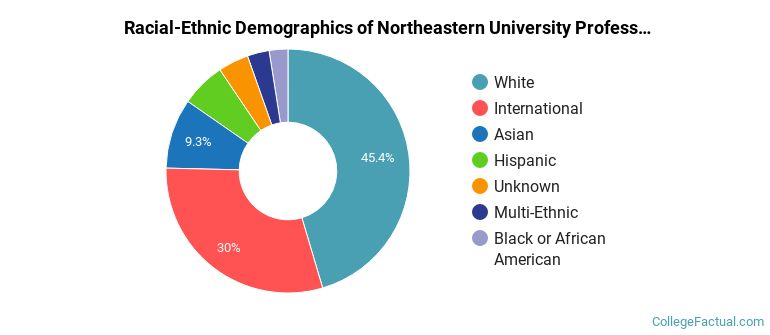
| Race/Ethnicity | Number |
|---|---|
| International | 4,009 |
| White | 3,714 |
| Unknown | 1,023 |
| Asian | 860 |
| Black or African American | 764 |
| Hispanic | 681 |
| Multi-Ethnic | 245 |
| Native Hawaiian or Pacific Islander | 6 |

There are approximately 6,586 female students and 4,724 male students at Northeastern University Professional Advancement Network.
Learn more about international students at Northeastern University Professional Advancement Network.
A traditional college student is defined as being between the ages of 18-21. At Northeastern University Professional Advancement Network, 15.26% of students fall into that category, compared to the national average of 60%.
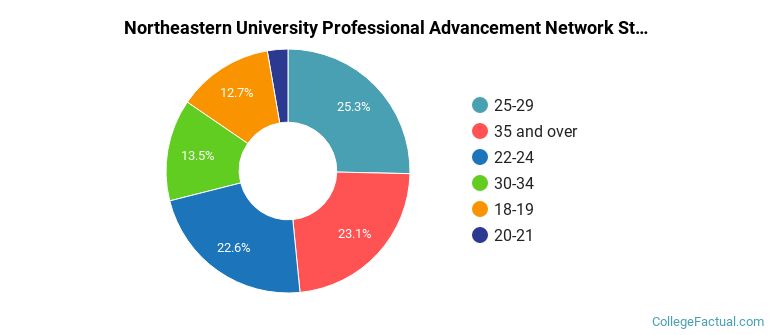
| Student Age Group | Amount |
|---|---|
| 25-29 | 2,780 |
| 35 and over | 2,531 |
| 22-24 | 2,482 |
| 30-34 | 1,479 |
| 18-19 | 1,396 |
| 20-21 | 299 |
| Under 18 | 0 |
Footnotes
*The racial-ethnic minorities count is calculated by taking the total number of students and subtracting white students, international students, and students whose race/ethnicity was unknown. This number is then divided by the total number of students at the school to obtain the racial-ethnic minorities percentage.
References
Department of Homeland Security Citizenship and Immigration Services
Read College Factual's Diversity Ranking Methodology.