Northeastern total enrollment is approximately 22,905 students. 15,131 are undergraduates and 6,917 are graduate students.
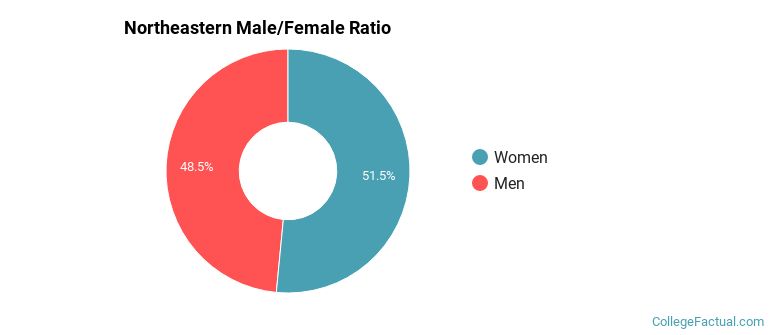
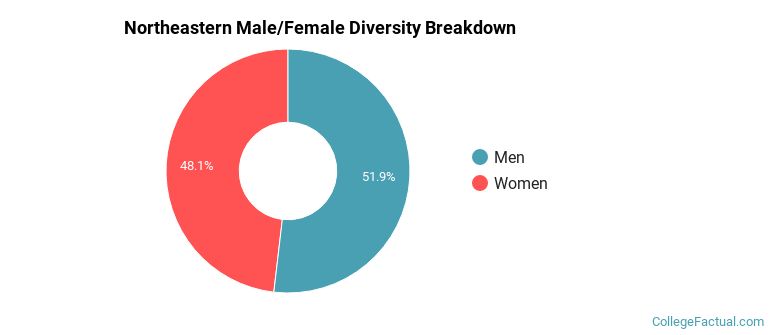
Male/Female Breakdown of Undergraduates
The full-time Northeastern undergraduate population is made up of 51% women, and 49% men.
For the gender breakdown for all students, go here.
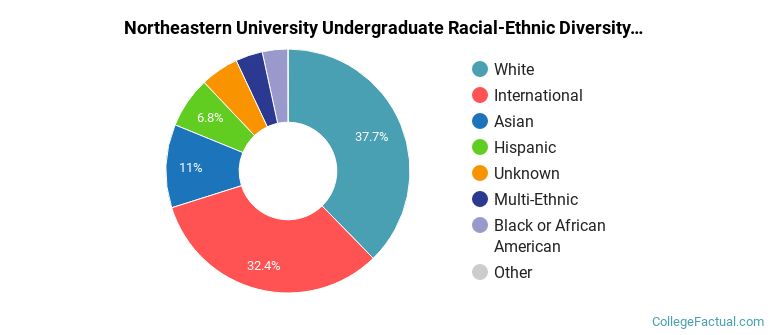
Northeastern Racial/Ethnic Breakdown of Undergraduates
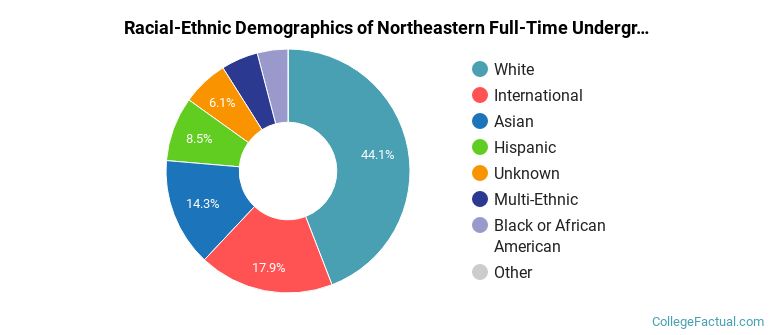
| Race/Ethnicity | Number |
|---|---|
| White | 6,796 |
| Asian | 2,629 |
| International | 2,426 |
| Hispanic | 1,375 |
| Multi-Ethnic | 818 |
| Black or African American | 621 |
| Unknown | 458 |
| Native Hawaiian or Pacific Islander | 1 |
See racial/ethnic breakdown for all students.
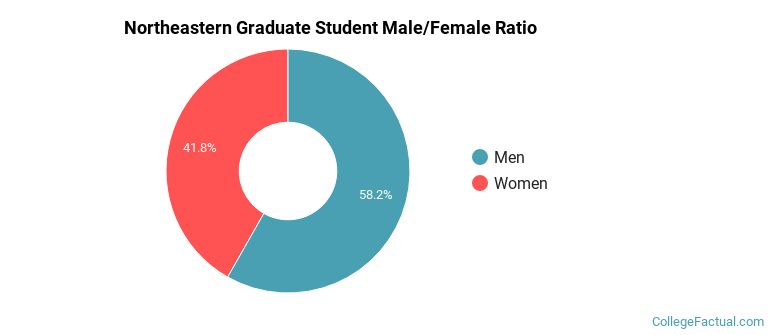
Male/Female Breakdown of Graduate Students
About 43% of full-time grad students are women, and 57% men.
For the gender breakdown for all students, go here.
Northeastern Racial-Ethnic Breakdown of Graduate Students
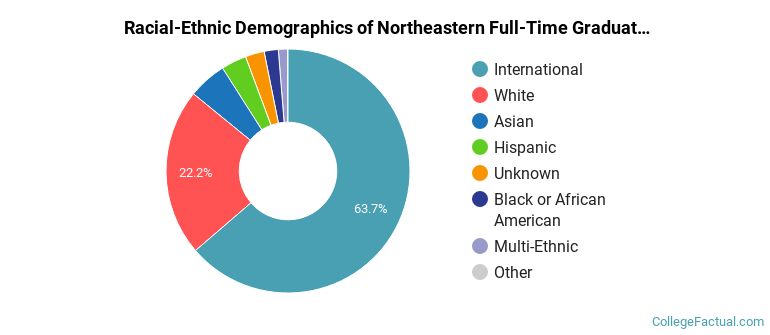
| Race/Ethnicity | Number |
|---|---|
| International | 4,143 |
| White | 1,690 |
| Asian | 402 |
| Hispanic | 252 |
| Black or African American | 161 |
| Unknown | 154 |
| Multi-Ethnic | 114 |
| Native Hawaiian or Pacific Islander | 0 |
See racial/ethnic breakdown for all students.
| Race/Ethnicity | Number |
|---|---|
| White | 8,961 |
| International | 6,687 |
| Asian | 3,103 |
| Hispanic | 1,670 |
| Multi-Ethnic | 948 |
| Black or African American | 834 |
| Unknown | 693 |
| Native Hawaiian or Pacific Islander | 1 |
There are approximately 11,168 female students and 11,737 male students at Northeastern.
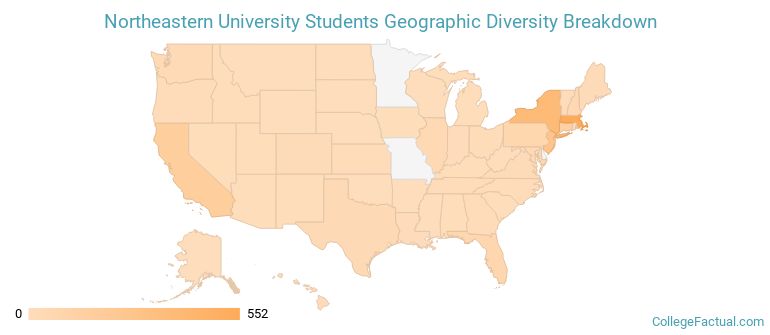
Northeastern ranks 54 out of 2,183 when it comes to geographic diversity.
74.75% of Northeastern students come from out of state, and 18.05% come from out of the country.
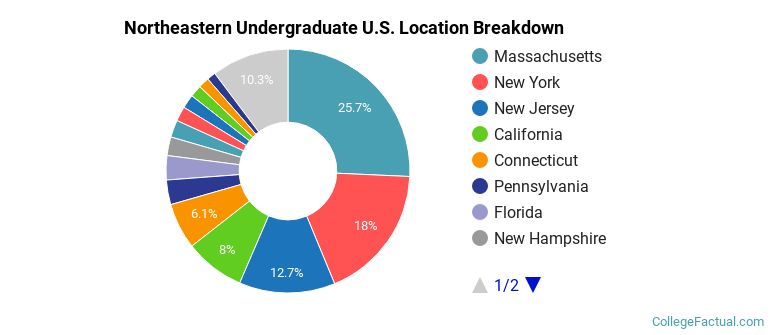
The undergraduate student body is split among 45 states (may include Washington D.C.). Click on the map for more detail.
| State | Amount |
|---|---|
| Massachusetts | 552 |
| New York | 387 |
| New Jersey | 273 |
| California | 171 |
| Connecticut | 131 |
Students from 146 countries are represented at this school, with the majority of the international students coming from China, India, and Taiwan.
Learn more about international students at Northeastern.
A traditional college student is defined as being between the ages of 18-21. At Northeastern, 52.42% of students fall into that category, compared to the national average of 60%.
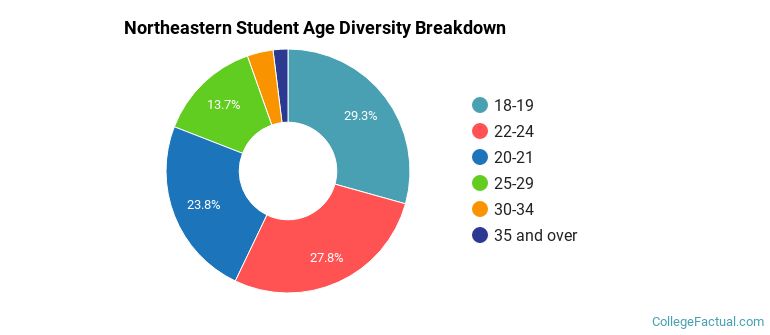
| Student Age Group | Amount |
|---|---|
| 18-19 | 6,220 |
| 22-24 | 5,888 |
| 20-21 | 5,045 |
| 25-29 | 2,903 |
| 30-34 | 729 |
| 35 and over | 417 |
| Under 18 | 0 |
Footnotes
*The racial-ethnic minorities count is calculated by taking the total number of students and subtracting white students, international students, and students whose race/ethnicity was unknown. This number is then divided by the total number of students at the school to obtain the racial-ethnic minorities percentage.
References
Department of Homeland Security Citizenship and Immigration Services
Image Credit: By (User:Piotrus) under License
Learn more about how College Factual creates their Diversity Rankings.