NIU total enrollment is approximately 16,769 students. 10,472 are undergraduates and 1,896 are graduate students.
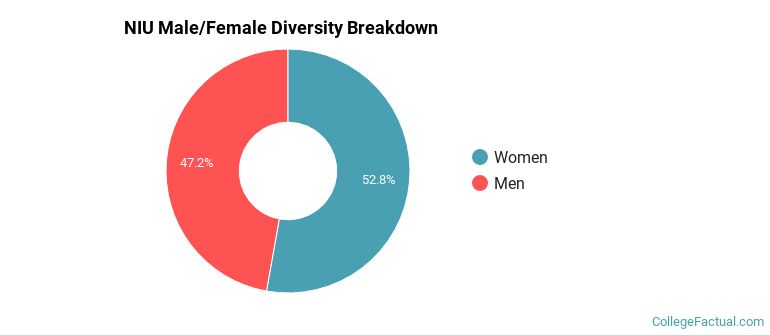
Male/Female Breakdown of Undergraduates
The full-time NIU undergraduate population is made up of 54% women, and 46% men.
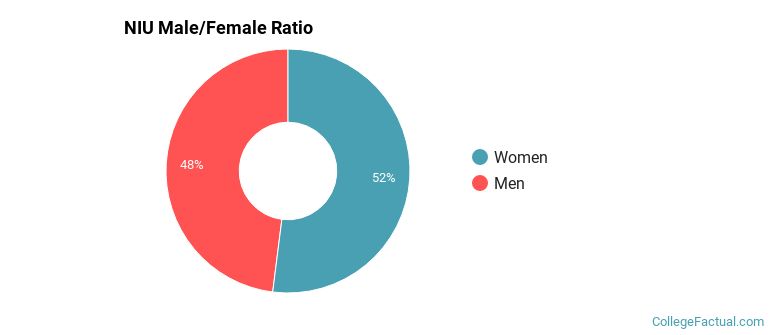
For the gender breakdown for all students, go here.
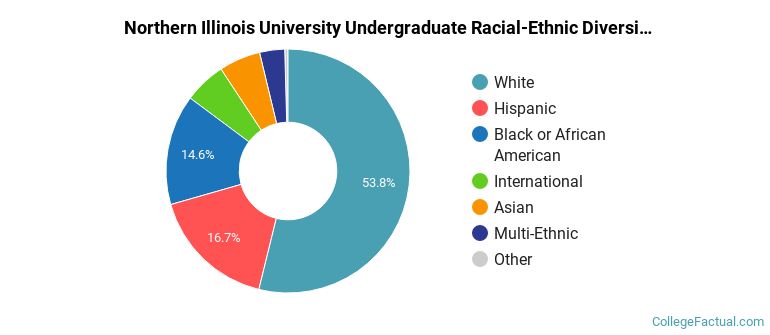
NIU Racial/Ethnic Breakdown of Undergraduates
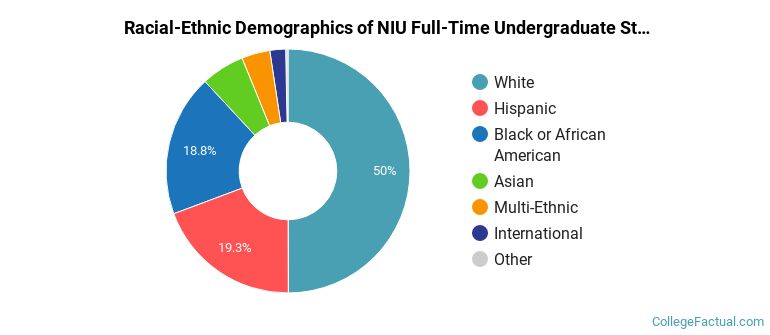
| Race/Ethnicity | Number |
|---|---|
| White | 4,927 |
| Hispanic | 2,206 |
| Black or African American | 2,139 |
| Asian | 596 |
| Multi-Ethnic | 410 |
| International | 156 |
| Unknown | 20 |
| Native Hawaiian or Pacific Islander | 6 |
See racial/ethnic breakdown for all students.
Male/Female Breakdown of Graduate Students
About 53% of full-time grad students are women, and 47% men.
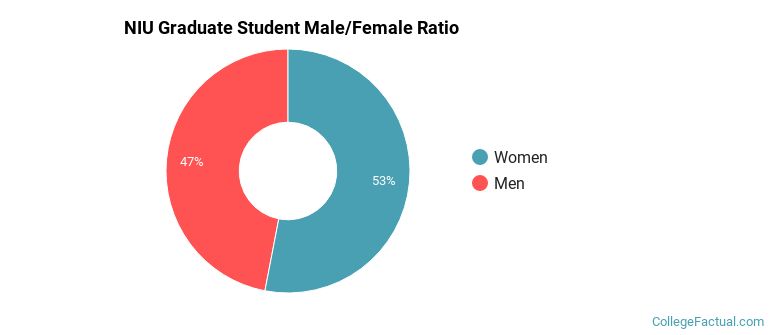
For the gender breakdown for all students, go here.
NIU Racial-Ethnic Breakdown of Graduate Students
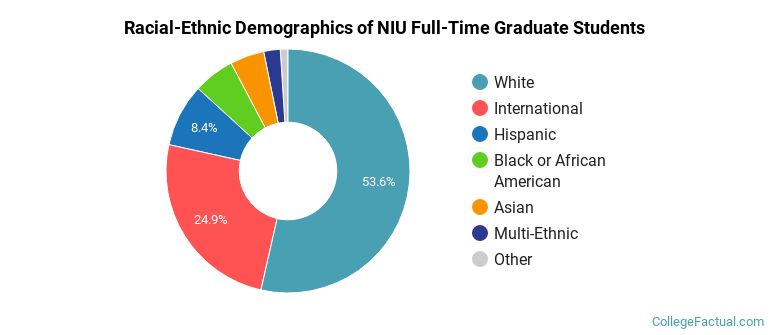
| Race/Ethnicity | Number |
|---|---|
| White | 1,036 |
| International | 392 |
| Hispanic | 178 |
| Black or African American | 125 |
| Asian | 98 |
| Multi-Ethnic | 45 |
| Unknown | 20 |
| Native Hawaiian or Pacific Islander | 1 |
See racial/ethnic breakdown for all students.
| Race/Ethnicity | Number |
|---|---|
| White | 8,619 |
| Hispanic | 3,099 |
| Black or African American | 2,695 |
| Asian | 944 |
| International | 735 |
| Multi-Ethnic | 579 |
| Unknown | 70 |
| Native Hawaiian or Pacific Islander | 10 |
There are approximately 9,095 female students and 7,674 male students at NIU.
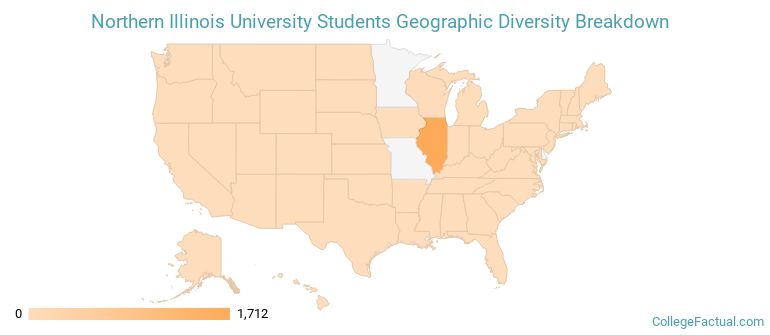
NIU ranks 1,543 out of 2,183 when it comes to geographic diversity.
4.62% of NIU students come from out of state, and 0.39% come from out of the country.
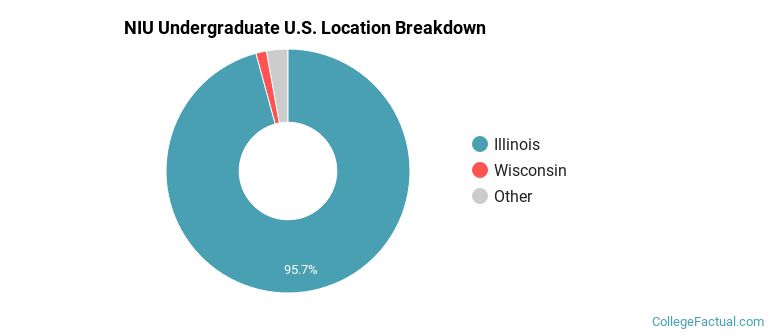
The undergraduate student body is split among 18 states (may include Washington D.C.). Click on the map for more detail.
| State | Amount |
|---|---|
| Illinois | 1,712 |
| Wisconsin | 25 |
| Michigan | 10 |
| Indiana | 8 |
| Ohio | 5 |
Students from 78 countries are represented at this school, with the majority of the international students coming from India, China, and Saudi Arabia.
Learn more about international students at NIU.
A traditional college student is defined as being between the ages of 18-21. At NIU, 42.60% of students fall into that category, compared to the national average of 60%.
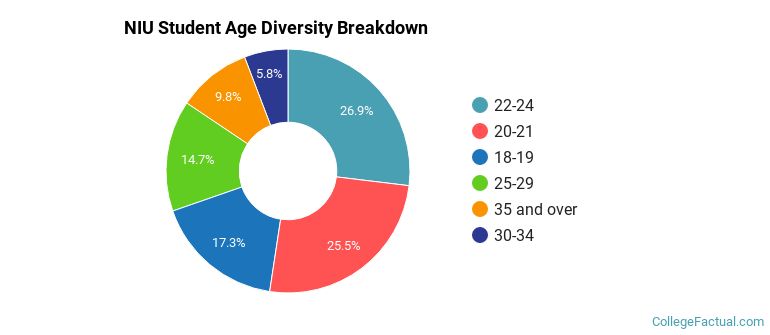
| Student Age Group | Amount |
|---|---|
| 22-24 | 4,841 |
| 20-21 | 4,582 |
| 18-19 | 3,106 |
| 25-29 | 2,649 |
| 35 and over | 1,761 |
| 30-34 | 1,043 |
| Under 18 | 0 |
Footnotes
*The racial-ethnic minorities count is calculated by taking the total number of students and subtracting white students, international students, and students whose race/ethnicity was unknown. This number is then divided by the total number of students at the school to obtain the racial-ethnic minorities percentage.
References
Department of Homeland Security Citizenship and Immigration Services
Image Credit: By Andy McMurray under License