NKU total enrollment is approximately 16,211 students. 8,024 are undergraduates and 1,206 are graduate students.
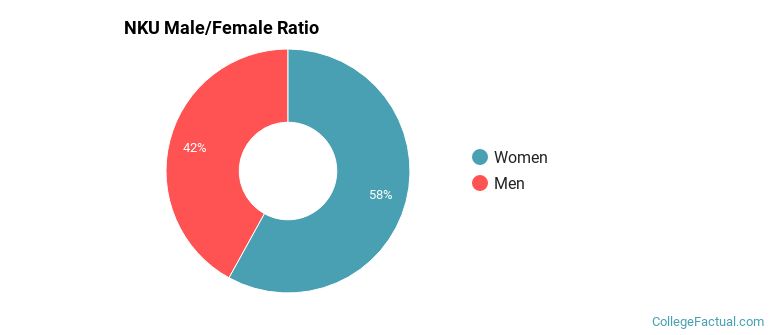
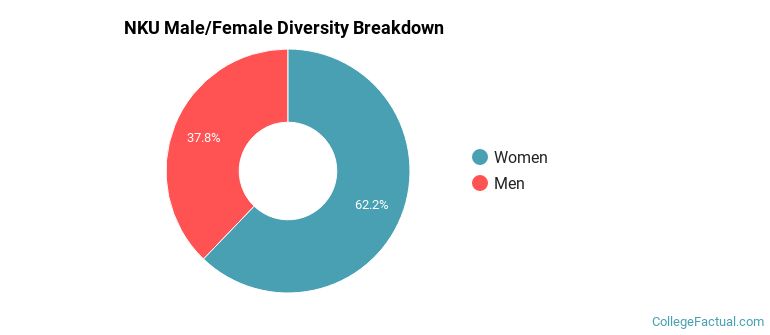
Male/Female Breakdown of Undergraduates
The full-time NKU undergraduate population is made up of 59% women, and 41% men.
For the gender breakdown for all students, go here.
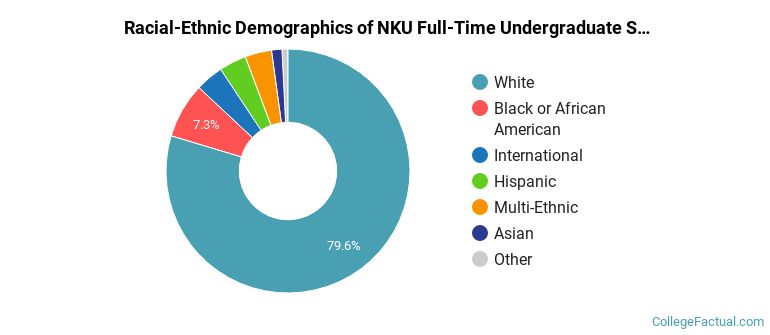
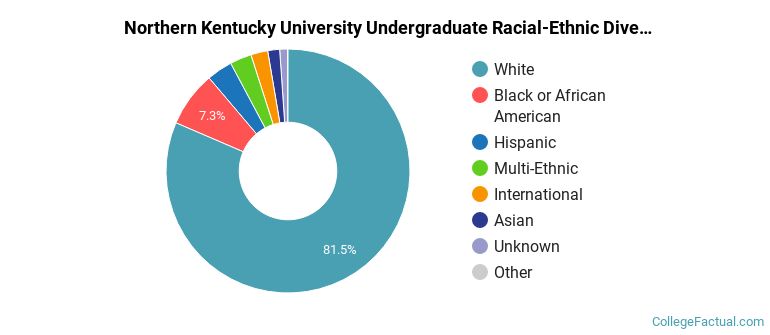
NKU Racial/Ethnic Breakdown of Undergraduates
| Race/Ethnicity | Number |
|---|---|
| White | 6,361 |
| Black or African American | 558 |
| Hispanic | 327 |
| Multi-Ethnic | 266 |
| International | 233 |
| Unknown | 129 |
| Asian | 127 |
| Native Hawaiian or Pacific Islander | 13 |
See racial/ethnic breakdown for all students.
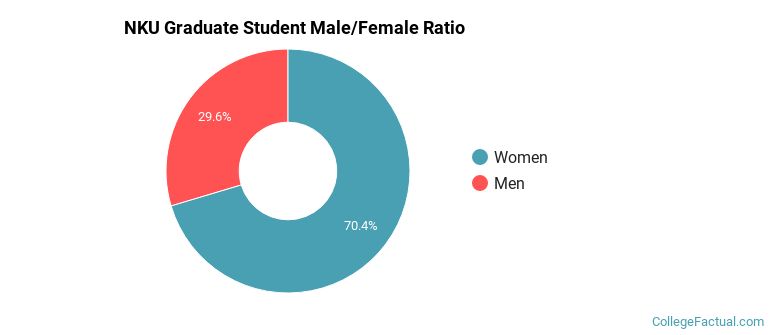
Male/Female Breakdown of Graduate Students
About 69% of full-time grad students are women, and 31% men.
For the gender breakdown for all students, go here.
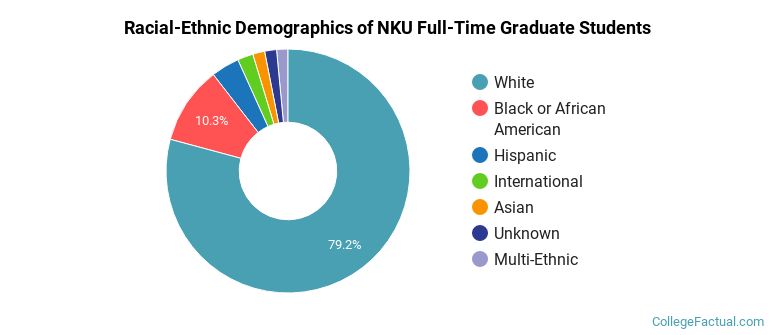
NKU Racial-Ethnic Breakdown of Graduate Students
| Race/Ethnicity | Number |
|---|---|
| White | 961 |
| Black or African American | 124 |
| Hispanic | 39 |
| Asian | 32 |
| International | 15 |
| Multi-Ethnic | 14 |
| Unknown | 14 |
| Native Hawaiian or Pacific Islander | 1 |
See racial/ethnic breakdown for all students.
| Race/Ethnicity | Number |
|---|---|
| White | 13,012 |
| Black or African American | 1,293 |
| Hispanic | 593 |
| Multi-Ethnic | 460 |
| Asian | 302 |
| International | 272 |
| Unknown | 234 |
| Native Hawaiian or Pacific Islander | 20 |
There are approximately 10,347 female students and 5,864 male students at NKU.
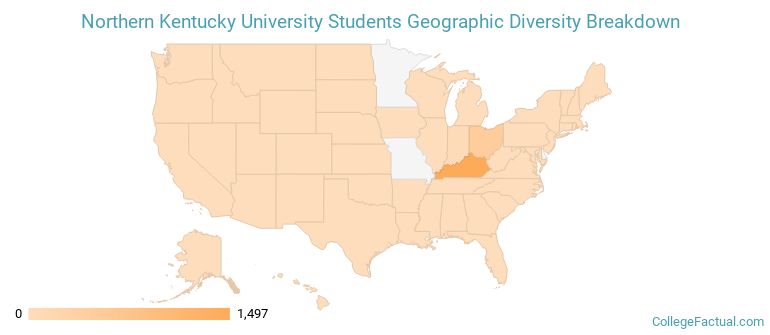
NKU ranks 1,113 out of 2,183 when it comes to geographic diversity.
28.06% of NKU students come from out of state, and 3.07% come from out of the country.
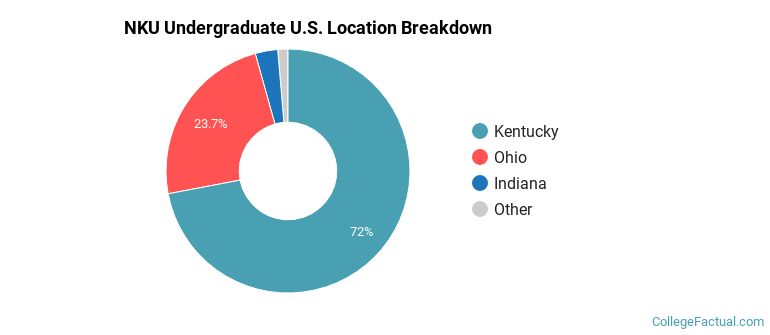
The undergraduate student body is split among 18 states (may include Washington D.C.). Click on the map for more detail.
| State | Amount |
|---|---|
| Kentucky | 1,497 |
| Ohio | 492 |
| Indiana | 62 |
| Georgia | 4 |
| California | 3 |
Students from 70 countries are represented at this school, with the majority of the international students coming from Saudi Arabia, India, and China.
Learn more about international students at NKU.
A traditional college student is defined as being between the ages of 18-21. At NKU, 46.14% of students fall into that category, compared to the national average of 60%.
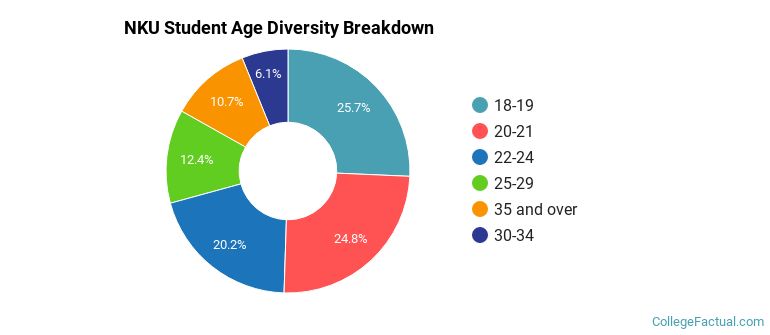
| Student Age Group | Amount |
|---|---|
| 18-19 | 3,393 |
| 20-21 | 3,277 |
| 22-24 | 2,671 |
| 25-29 | 1,639 |
| 35 and over | 1,414 |
| 30-34 | 810 |
| Under 18 | 0 |
Footnotes
*The racial-ethnic minorities count is calculated by taking the total number of students and subtracting white students, international students, and students whose race/ethnicity was unknown. This number is then divided by the total number of students at the school to obtain the racial-ethnic minorities percentage.
References
Department of Homeland Security Citizenship and Immigration Services
Read College Factual's Diversity Ranking Methodology.