Explore the best ranked schools for the programs you are most interested in.
Northwest State Community College is ranked #1,544 out of 2,152 schools in the nation for overall quality on College Factual's 2025 Best Colleges list. This is an improvement over the previous year, when Northwest State Community College held the #1,745 spot on the Best Overall Colleges list.
Out of the 91 colleges in Ohio, Northwest State Community College is ranked at #62.
See all of the rankings for Northwest State Community College.
Northwest State Community College has an open admissions policy, so you should not have much trouble being accepted by the school. Still, it is important to fill out the application completely and submit any requested materials, which may include proof that you have a high school diploma or the equivalent.
The student to faculty ratio at Northwest State Community College is 25 to 1, which is high when compared to the national average of 15 to 1. This may indicate that some of your classes will be larger in size than they would be at other schools. However, upper level classes will probably be smaller.
The freshmen retention rate of 75% tells us that most first-year, full-time students like Northwest State Community College enough to come back for another year. This is a fair bit higher than the national average of 68%. That's certainly something to check off in the good column about the school.
During the 2017-2018 academic year, there were 3,736 undergraduates at Northwest State Community College with 555 being full-time and 3,181 being part-time.
| $0-30 K | $30K-48K | $48-75 | $75-110K | $110K + |
|---|---|---|---|---|
| $10,165 | $10,851 | $12,776 | $13,910 | $15,311 |
The net price is calculated by adding tuition, room, board and other costs and subtracting financial aid.Note that the net price is typically less than the published for a school. For more information on the sticker price of Northwest State Community College, see our tuition and fees and room and board pages.
Almost 66% of college students who graduated with the class of 2018 took out student loans, but that percentage varies from school to school. At Northwest State Community College, approximately 18% of students took out student loans averaging $3,263 a year. That adds up to $13,052 over four years for those students.
Get more details about paying for Northwest State Community College.
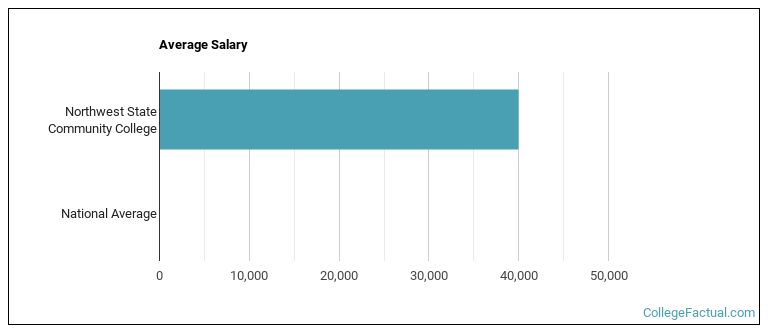
See which majors at Northwest State Community College make the most money.
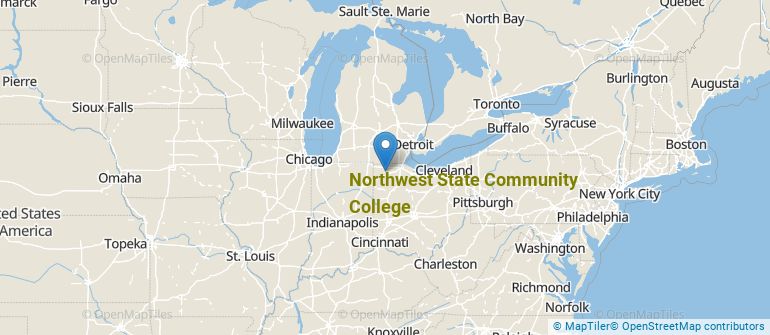
Get more details about the location of Northwest State Community College.
Contact details for Northwest State Community College are given below.
| Contact Details | |
|---|---|
| Address: | 22600 State Route 34, Archbold, OH 43502-9542 |
| Phone: | 419-267-5511 |
| Website: | https://northweststate.edu/ |
| Most Popular Majors | Bachelor’s Degrees | Average Salary of Graduates |
|---|---|---|
| Engineering Technology (Other) | 67 | NA |
| Nursing | 32 | NA |
| Business Administration & Management | 30 | NA |
| Mechanical Engineering Technology | 23 | NA |
| Liberal Arts General Studies | 23 | NA |
| Social Work | 18 | NA |
| Clinical/Medical Laboratory Science | 17 | NA |
| Heavy/Industrial Equipment Maintenance | 17 | NA |
| Accounting | 16 | NA |
| Criminal Justice & Corrections | 16 | NA |
Online learning options are becoming more and more popular at American colleges and universities. Online classes are great for students who have busy schedules or for those who just want to study on their own time.
In 2022-2023, 1,251 students took at least one online class at Northwest State Community College. This is an increase from the 1,156 students who took online classes the previous year.
| Year | Took at Least One Online Class | Took All Classes Online |
|---|---|---|
| 2022-2023 | 1,251 | 605 |
| 2021-2022 | 1,156 | 593 |
| 2020-2021 | 1,053 | 577 |
| 2018-2019 | 695 | 349 |
Learn more about online learning at Northwest State Community College.
Footnotes
*The racial-ethnic minorities count is calculated by taking the total number of students and subtracting white students, international students, and students whose race/ethnicity was unknown. This number is then divided by the total number of students at the school to obtain the racial-ethnic minorities percentage.
References
More about our data sources and methodologies.