We've pulled together some essential information you should know about the program, including how many students graduate each year, the ethnic diversity of these students, and more. Also, learn how NCCC ranks among other schools offering degrees in nursing.
Go directly to any of the following sections:
The nursing major at NCCC is not ranked on College Factual’s Best Colleges and Universities for Nursing. This could be for a number of reasons, such as not having enough data on the major or school to make an accurate assessment of its quality.
Online degrees for the NCCC nursing bachelor’s degree program are not available at this time. To see if the school offers distance learning options in other areas, visit the NCCC Online Learning page.
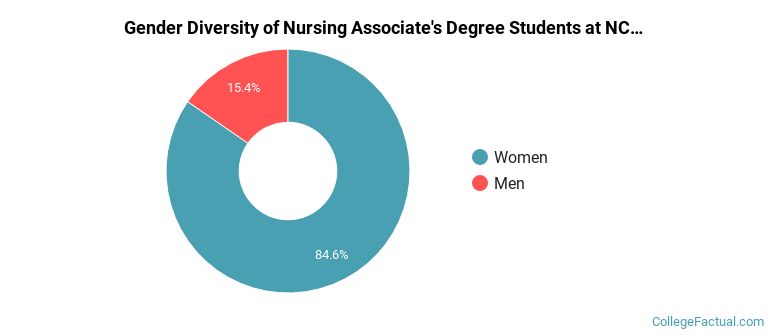
During the 2021-2022 academic year, 26 students graduated with a associate's degree in nursing from NCCC. About 15% were men and 85% were women.
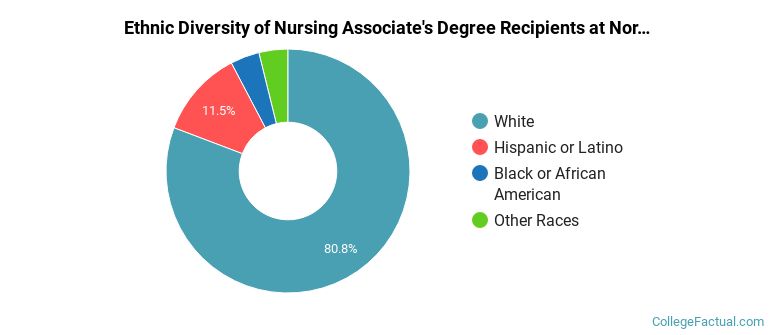
The majority of the students with this major are white. About 81% of 2022 graduates were in this category.
The following table and chart show the ethnic background for students who recently graduated from Northwestern Connecticut Community College with a associate's in nursing.
| Ethnic Background | Number of Students |
|---|---|
| Asian | 0 |
| Black or African American | 1 |
| Hispanic or Latino | 3 |
| White | 21 |
| Non-Resident Aliens | 0 |
| Other Races | 1 |
| Related Major | Annual Graduates |
|---|---|
| Allied Health & Medical Assisting Services | 18 |
| Health & Medical Administrative Services | 7 |
| Rehabilitation & Therapeutic Professions | 5 |