Northwestern total enrollment is approximately 22,603 students. 8,095 are undergraduates and 9,641 are graduate students.
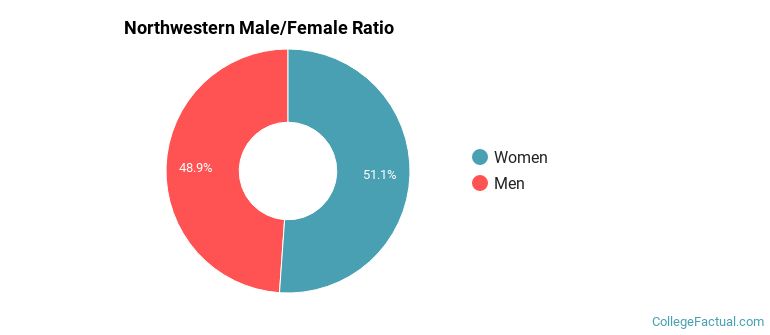
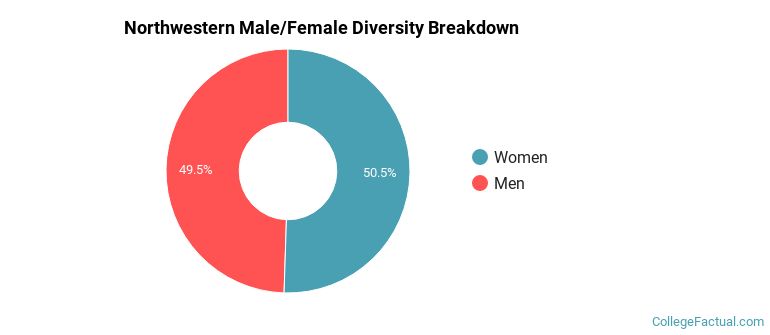
Male/Female Breakdown of Undergraduates
The full-time Northwestern undergraduate population is made up of 52% women, and 48% men.
For the gender breakdown for all students, go here.
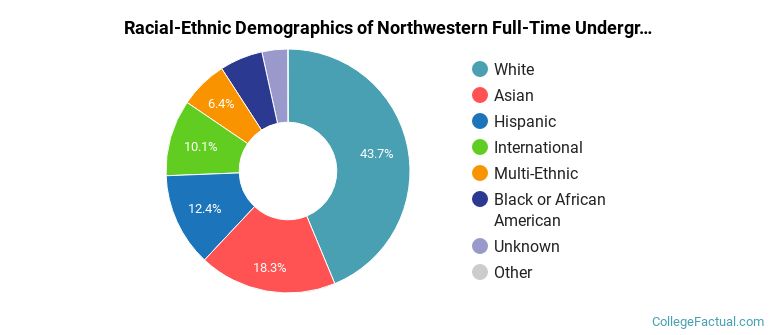
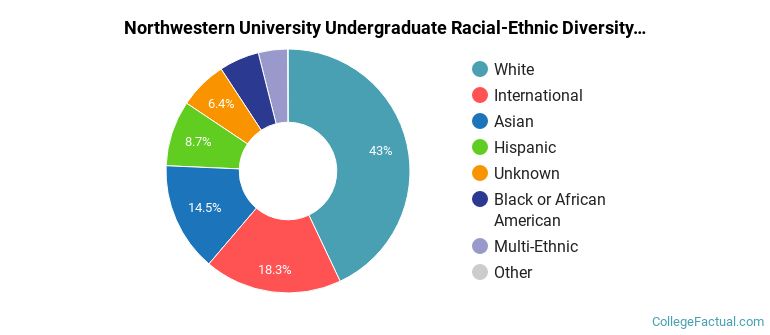
Northwestern Racial/Ethnic Breakdown of Undergraduates
| Race/Ethnicity | Number |
|---|---|
| White | 3,332 |
| Asian | 1,581 |
| Hispanic | 1,050 |
| International | 823 |
| Multi-Ethnic | 503 |
| Black or African American | 485 |
| Unknown | 312 |
| Native Hawaiian or Pacific Islander | 2 |
See racial/ethnic breakdown for all students.
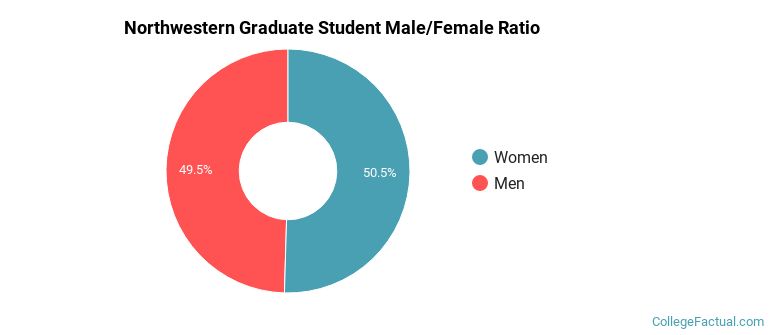
Male/Female Breakdown of Graduate Students
About 52% of full-time grad students are women, and 48% men.
For the gender breakdown for all students, go here.
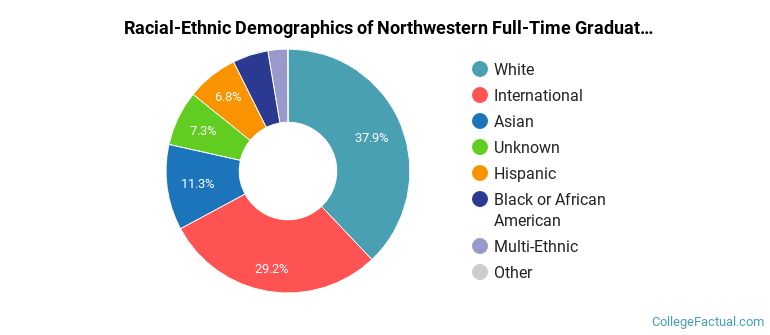
Northwestern Racial-Ethnic Breakdown of Graduate Students
| Race/Ethnicity | Number |
|---|---|
| White | 3,942 |
| International | 2,416 |
| Asian | 1,191 |
| Hispanic | 720 |
| Unknown | 581 |
| Black or African American | 490 |
| Multi-Ethnic | 287 |
| Native Hawaiian or Pacific Islander | 2 |
See racial/ethnic breakdown for all students.
| Race/Ethnicity | Number |
|---|---|
| White | 9,745 |
| International | 3,675 |
| Asian | 3,507 |
| Hispanic | 2,089 |
| Unknown | 1,361 |
| Black or African American | 1,282 |
| Multi-Ethnic | 907 |
| Native Hawaiian or Pacific Islander | 8 |
There are approximately 11,697 female students and 10,906 male students at Northwestern.
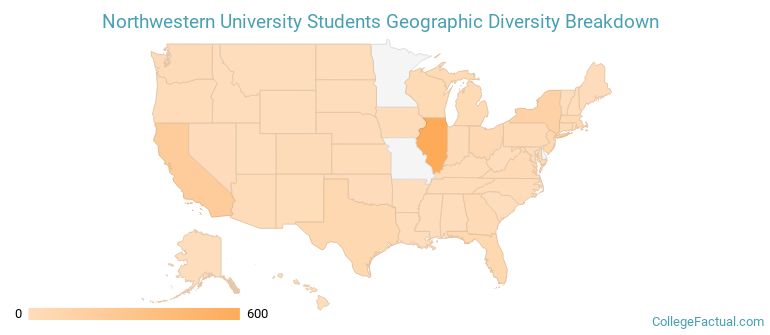
Northwestern ranks 96 out of 2,183 when it comes to geographic diversity.
66.42% of Northwestern students come from out of state, and 9.87% come from out of the country.
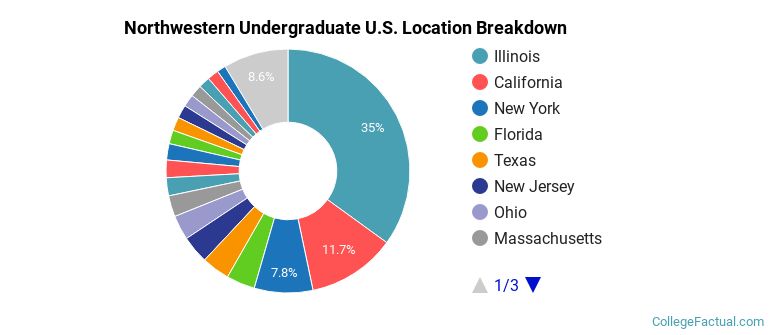
The undergraduate student body is split among 46 states (may include Washington D.C.). Click on the map for more detail.
| State | Amount |
|---|---|
| Illinois | 600 |
| California | 201 |
| New York | 133 |
| Florida | 65 |
| Texas | 64 |
Students from 116 countries are represented at this school, with the majority of the international students coming from China, India, and South Korea.
Learn more about international students at Northwestern.
A traditional college student is defined as being between the ages of 18-21. At Northwestern, 34.95% of students fall into that category, compared to the national average of 60%.
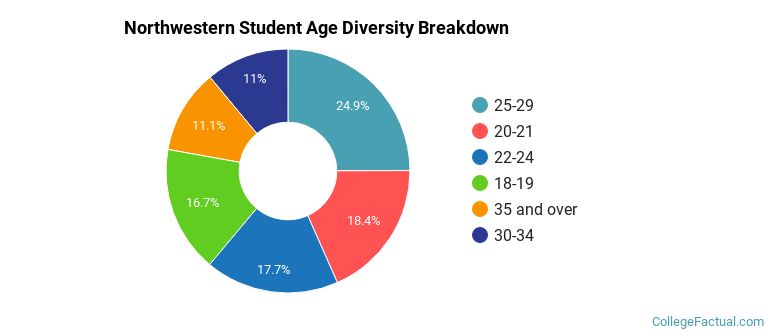
| Student Age Group | Amount |
|---|---|
| 25-29 | 5,456 |
| 20-21 | 4,031 |
| 22-24 | 3,878 |
| 18-19 | 3,661 |
| 35 and over | 2,436 |
| 30-34 | 2,415 |
| Under 18 | 0 |
Footnotes
*The racial-ethnic minorities count is calculated by taking the total number of students and subtracting white students, international students, and students whose race/ethnicity was unknown. This number is then divided by the total number of students at the school to obtain the racial-ethnic minorities percentage.
References
Department of Homeland Security Citizenship and Immigration Services
Image Credit: By Madcoverboy at en.wikipedia under License
Learn more about how College Factual creates their Diversity Rankings.