Explore the best ranked schools for the programs you are most interested in.
College Factual ranked NDC as #1,814 out of 2,152 colleges and universities in the country on its 2025 Best Colleges list. This is an improvement over the previous year, when NDC held the #2,002 spot on the Best Overall Colleges list.
NDC also holds the #76 spot on the Best Colleges in Ohio ranking.
Notre Dame College has an acceptance rate of 79%, which makes it somewhat selective. Make sure it's not the only school you apply to, even if it's your school of choice. Whether you get in or not will largely depend on how you compare to other applicants.
The student to faculty ratio is often used to measure the number of teaching resources that a college or university offers its students. The national average for this metric is 15 to 1, but at NDC it is much better at 11 to 1. That's good news for students who want to interact more on a personal level with their teachers.
Another measure that is often used to estimate how much access students will have to their professors is how many faculty members are full-time. The idea here is that part-time faculty tend to spend less time on campus, so they may not be as available to students as full-timers.
The full-time faculty percentage at Notre Dame College is 36%. This is lower than the national average of 47%.
The freshmen retention rate is a sign of how many full-time students like a college or university well enough to come back for their sophomore year. At Notre Dame College this rate is 62%, which is a bit lower than the national average of 68%.
The on-time graduation rate is the percent of first-time, full time students who obtain their bachelor's degree in four years or less. This rate is 26% for first-time, full-time students at NDC, which is lower than the national rate of 33.3%.
Find out more about the retention and graduation rates at Notre Dame College.
During the 2017-2018 academic year, there were 1,470 undergraduates at NDC with 1,122 being full-time and 348 being part-time.
| $0-30 K | $30K-48K | $48-75 | $75-110K | $110K + |
|---|---|---|---|---|
| $11,475 | $13,582 | $14,919 | $15,949 | $20,007 |
The net price is calculated by adding tuition, room, board and other costs and subtracting financial aid.Note that the net price is typically less than the published for a school. For more information on the sticker price of NDC, see our tuition and fees and room and board pages.
It's not uncommon for college students to take out loans to pay for school. In fact, almost 66% of students nationwide depend at least partially on loans. At NDC, approximately 74% of students took out student loans averaging $6,015 a year. That adds up to $24,060 over four years for those students.
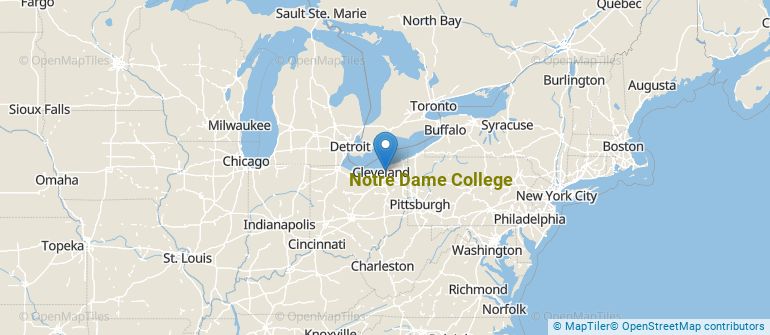
Get more details about the location of Notre Dame College.
Contact details for NDC are given below.
| Contact Details | |
|---|---|
| Address: | 4545 College Rd, Cleveland, OH 44121-4293 |
| Phone: | 216-381-1680 |
| Website: | www.notredamecollege.edu/ |
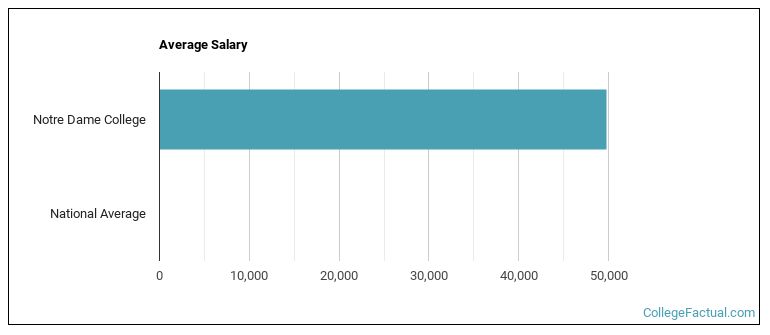
| Most Popular Majors | Bachelor’s Degrees | Average Salary of Graduates |
|---|---|---|
| Business Administration & Management | 40 | $44,654 |
| General Psychology | 23 | $32,526 |
| Special Education | 22 | $35,789 |
| Other Business, Management & Marketing | 19 | $26,541 |
| Nursing | 18 | $64,474 |
| General Biology | 14 | NA |
| Criminal Justice & Corrections | 14 | $29,704 |
| Teacher Education Grade Specific | 11 | $35,991 |
| Accounting | 10 | NA |
| Communication & Media Studies | 10 | NA |
Online learning is becoming popular at even the oldest colleges and universities in the United States. Not only are online classes great for returning adults with busy schedules, they are also frequented by a growing number of traditional students.
In 2022-2023, 775 students took at least one online class at Notre Dame College. This is an increase from the 543 students who took online classes the previous year.
| Year | Took at Least One Online Class | Took All Classes Online |
|---|---|---|
| 2022-2023 | 775 | 534 |
| 2021-2022 | 543 | 329 |
| 2020-2021 | 492 | 286 |
| 2018-2019 | 465 | 334 |
Footnotes
*The racial-ethnic minorities count is calculated by taking the total number of students and subtracting white students, international students, and students whose race/ethnicity was unknown. This number is then divided by the total number of students at the school to obtain the racial-ethnic minorities percentage.
References
More about our data sources and methodologies.