NUS Florida total enrollment is approximately 20,888 students. 5,366 are undergraduates and 9,116 are graduate students.
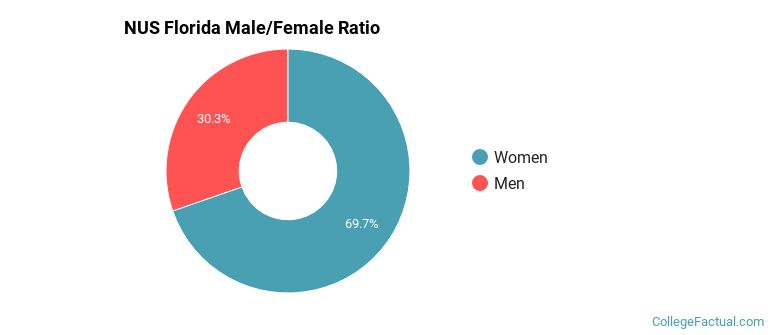
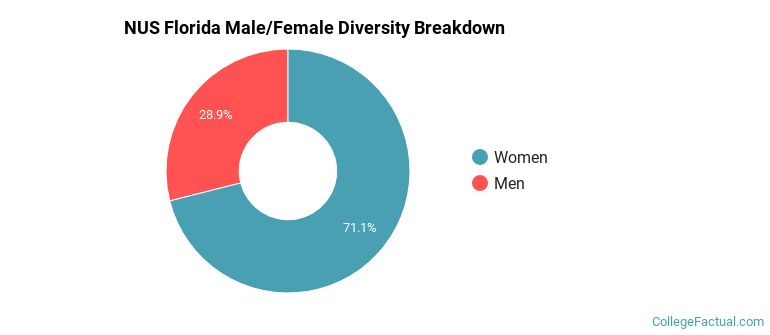
Male/Female Breakdown of Undergraduates
The full-time NUS Florida undergraduate population is made up of 70% women, and 30% men.
For the gender breakdown for all students, go here.
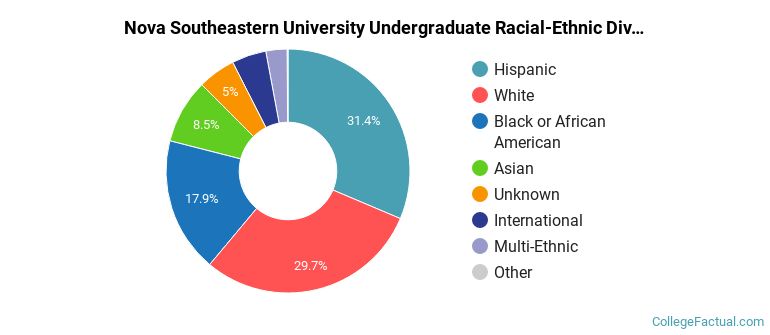
NUS Florida Racial/Ethnic Breakdown of Undergraduates
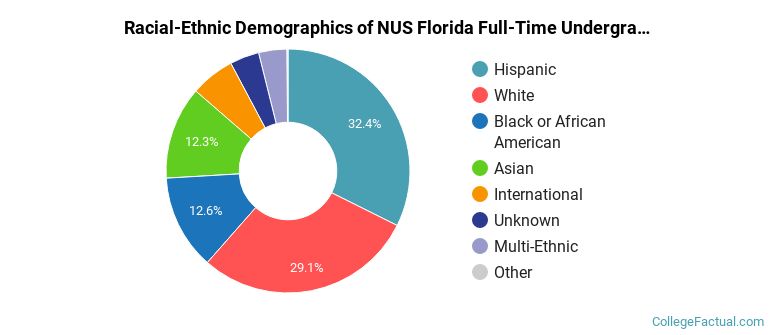
| Race/Ethnicity | Number |
|---|---|
| Hispanic | 1,795 |
| White | 1,496 |
| Black or African American | 723 |
| Asian | 668 |
| International | 270 |
| Multi-Ethnic | 217 |
| Unknown | 180 |
| Native Hawaiian or Pacific Islander | 5 |
See racial/ethnic breakdown for all students.
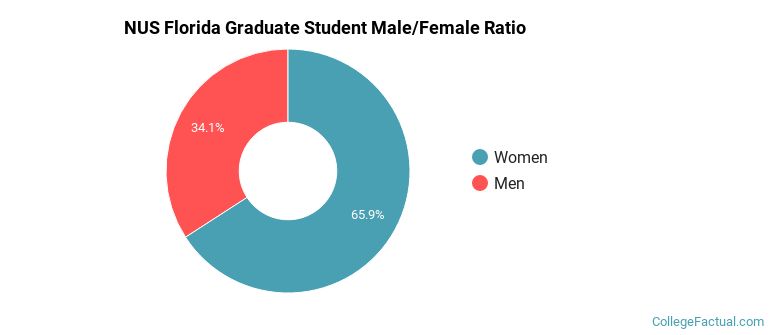
Male/Female Breakdown of Graduate Students
About 67% of full-time grad students are women, and 33% men.
For the gender breakdown for all students, go here.
NUS Florida Racial-Ethnic Breakdown of Graduate Students
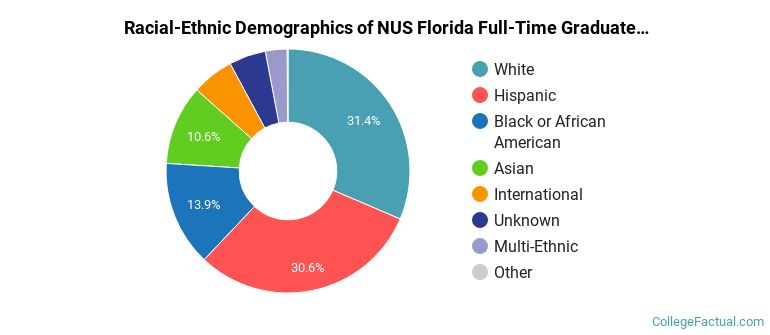
| Race/Ethnicity | Number |
|---|---|
| White | 2,934 |
| Hispanic | 2,869 |
| Black or African American | 1,234 |
| Asian | 941 |
| Unknown | 469 |
| International | 402 |
| Multi-Ethnic | 255 |
| Native Hawaiian or Pacific Islander | 7 |
See racial/ethnic breakdown for all students.
| Race/Ethnicity | Number |
|---|---|
| Hispanic | 6,728 |
| White | 6,197 |
| Black or African American | 3,685 |
| Asian | 1,828 |
| Unknown | 976 |
| International | 809 |
| Multi-Ethnic | 620 |
| Native Hawaiian or Pacific Islander | 20 |
There are approximately 14,969 female students and 5,919 male students at NUS Florida.
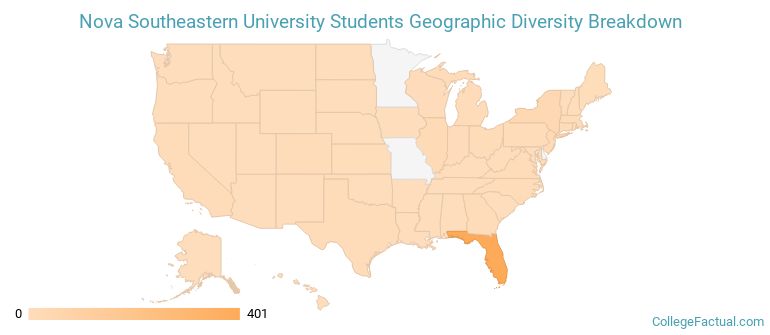
NUS Florida ranks 392 out of 2,183 when it comes to geographic diversity.
38.51% of NUS Florida students come from out of state, and 0.15% come from out of the country.
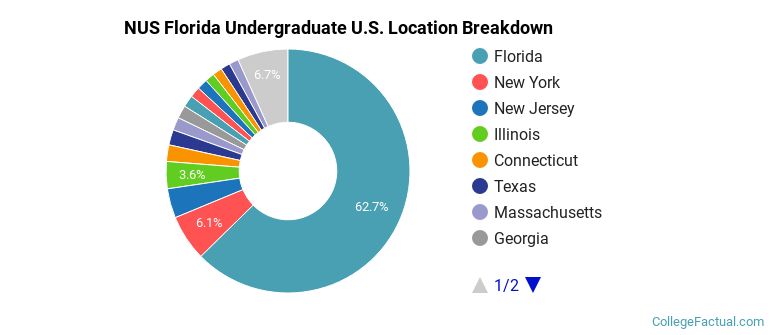
The undergraduate student body is split among 34 states (may include Washington D.C.). Click on the map for more detail.
| State | Amount |
|---|---|
| Florida | 401 |
| New York | 39 |
| New Jersey | 25 |
| Illinois | 23 |
| Connecticut | 14 |
Students from 109 countries are represented at this school, with the majority of the international students coming from Venezuela, Canada, and India.
Learn more about international students at NUS Florida.
A traditional college student is defined as being between the ages of 18-21. At NUS Florida, 13.13% of students fall into that category, compared to the national average of 60%.
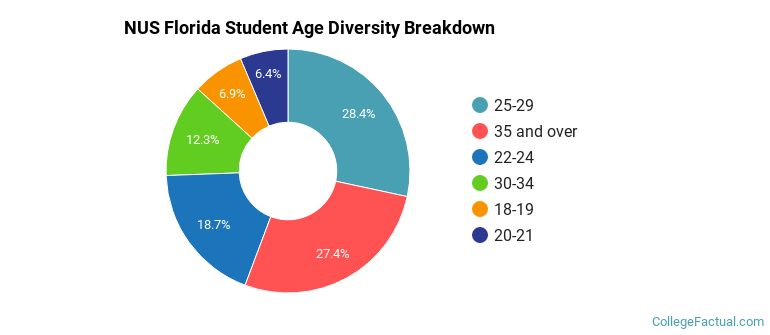
| Student Age Group | Amount |
|---|---|
| 25-29 | 5,839 |
| 35 and over | 5,632 |
| 22-24 | 3,846 |
| 30-34 | 2,540 |
| 18-19 | 1,418 |
| 20-21 | 1,312 |
| Under 18 | 0 |
Footnotes
*The racial-ethnic minorities count is calculated by taking the total number of students and subtracting white students, international students, and students whose race/ethnicity was unknown. This number is then divided by the total number of students at the school to obtain the racial-ethnic minorities percentage.
References