Explore the best ranked schools for the programs you are most interested in.
College Factual ranked Nunez Community College as #1,769 out of 2,152 colleges and universities in the country on its 2025 Best Colleges list.
Nunez Community College also holds the #16 spot on the Best Colleges in Louisiana ranking.
As long as you meet basic requirements, you should not have any trouble getting into Nunez Community College since the school has an open admissions policy. Still, be sure to submit any requested materials and that your application is completed in full.
The student to faculty ratio is often used as a measure to gauge how much access students will have to their professors - the lower the number, the better. At Nunez Community College, this rate is 23 to 1, which is high when compared to the national average of 15 to 1.
When estimating how much access students will have to their teachers, some people like to look at what percentage of faculty members are full time. This is because part-time teachers may not have as much time to spend on campus as their full-time counterparts.
The full-time faculty percentage at Nunez Community College is 44%. This is comparable to the national average of 47%.
The freshmen retention rate of 41% tells us that most first-year, full-time students don't stick around for a second year at Nunez Community College. Students may have a variety of reasons for this, such as only intending to attend a school for one year while they brush up on certain subjects.
During the 2017-2018 academic year, there were 2,166 undergraduates at Nunez Community College with 790 being full-time and 1,376 being part-time.
| $0-30 K | $30K-48K | $48-75 | $75-110K | $110K + |
|---|---|---|---|---|
| $12,399 | $11,258 | $12,897 | $15,699 | $15,746 |
The net price is calculated by adding tuition, room, board and other costs and subtracting financial aid.Note that the net price is typically less than the published for a school. For more information on the sticker price of Nunez Community College, see our tuition and fees and room and board pages.
While almost two-thirds of students nationwide take out loans to pay for college, the percentage may be quite different for the school you plan on attending. At Nunez Community College, approximately 46% of students took out student loans averaging $4,699 a year. That adds up to $18,796 over four years for those students.
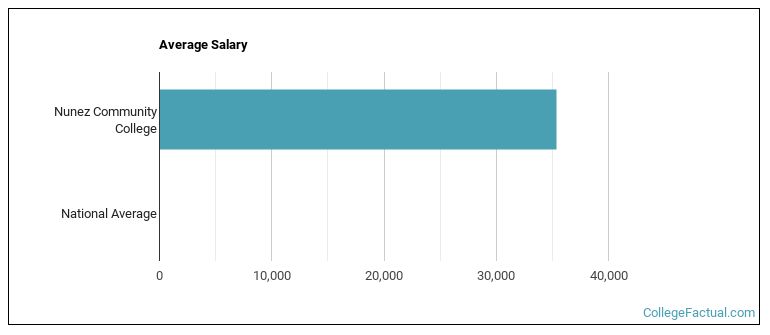
See which majors at Nunez Community College make the most money.
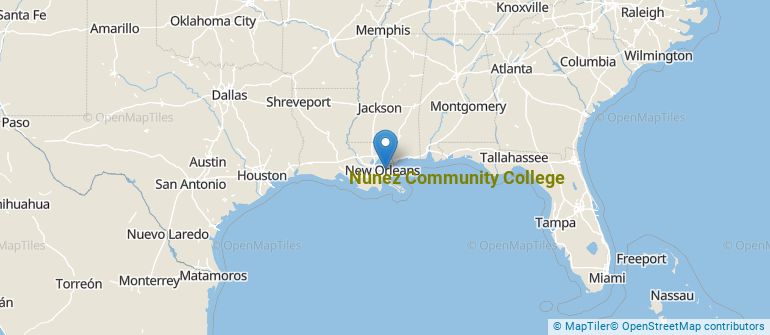
Get more details about the location of Nunez Community College.
Contact details for Nunez Community College are given below.
| Contact Details | |
|---|---|
| Address: | 3710 Paris Rd, Chalmette, LA 70043 |
| Phone: | 504-278-6467 |
| Website: | www.nunez.edu/ |
| Most Popular Majors | Bachelor’s Degrees | Average Salary of Graduates |
|---|---|---|
| Mechanical Engineering Technology | 70 | NA |
| Industrial Production Technology | 68 | NA |
| Liberal Arts General Studies | 58 | NA |
| Electrical & Power Transmission Installers | 38 | NA |
| Precision Metal Working | 34 | NA |
| Practical Nursing & Nursing Assistants | 30 | NA |
| General Business/Commerce | 27 | NA |
| Human Development & Family Studies | 22 | NA |
| Health & Medical Administrative Services | 21 | NA |
| Health Aids/Attendants/Orderlies | 20 | NA |
Online courses area a great option for busy, working students as well as for those who have scheduling conflicts and want to study on their own time. As time goes by, expect to see more and more online learning options become available.
In 2022-2023, 1,324 students took at least one online class at Nunez Community College. This is an increase from the 1,289 students who took online classes the previous year.
| Year | Took at Least One Online Class | Took All Classes Online |
|---|---|---|
| 2022-2023 | 1,324 | 741 |
| 2021-2022 | 1,289 | 662 |
| 2020-2021 | 1,489 | 636 |
| 2018-2019 | 993 | 320 |
Learn more about online learning at Nunez Community College.
Footnotes
*The racial-ethnic minorities count is calculated by taking the total number of students and subtracting white students, international students, and students whose race/ethnicity was unknown. This number is then divided by the total number of students at the school to obtain the racial-ethnic minorities percentage.
References
More about our data sources and methodologies.