We've pulled together some essential information you should know about the program, including how many students graduate each year, the ethnic diversity of these students, and more. In addition, we cover how OCC ranks in comparison to other schools with liberal arts programs.
Go directly to any of the following sections:
The bachelor's program at OCC was ranked #223 on College Factual's Best Schools for liberal arts list.
Learn about other programs related to Liberal Arts General Studies that might interest you.
Maximize your transfer credits and complete your bachelor's degree faster with this flexible online bachelor's from Southern New Hampshire University.
In 2022-2023, the average part-time undergraduate tuition at OCC was $270 per credit hour for out-of-state students. The average for in-state students was $198 per credit hour. Information about average full-time undergraduate tuition and fees is shown in the table below.
| In State | Out of State | |
|---|---|---|
| Tuition | $4,752 | $6,480 |
| Fees | $370 | $370 |
| Books and Supplies | $438 | $438 |
Learn more about OCC tuition and fees.
OCC does not offer an online option for its liberal arts bachelor’s degree program at this time. To see if the school offers distance learning options in other areas, visit the OCC Online Learning page.
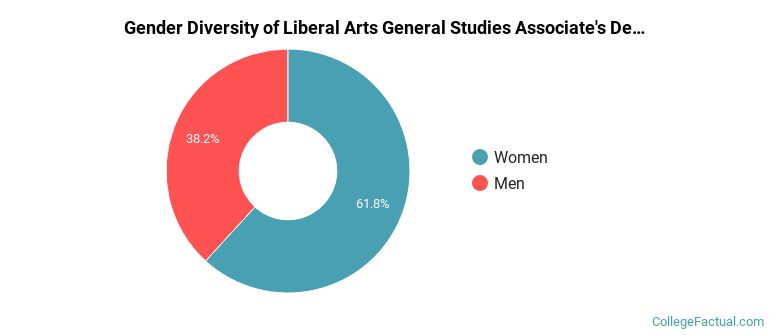
Of the 903 liberal arts students who graduated with a associate's degree in 2021-2022 from OCC, about 38% were men and 62% were women.
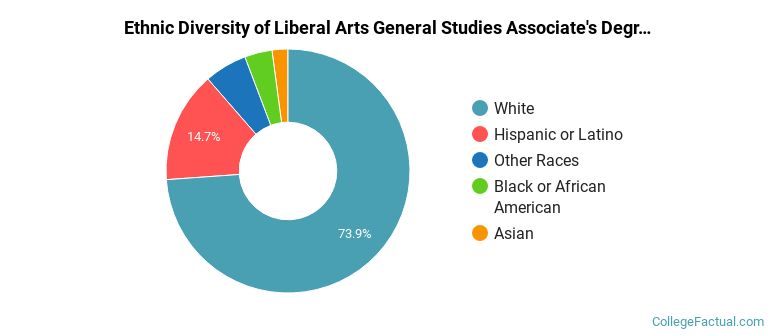
The majority of associate's degree recipients in this major at OCC are white. In the most recent graduating class for which data is available, 74% of students fell into this category.
The following table and chart show the ethnic background for students who recently graduated from Ocean County College with a associate's in liberal arts.
| Ethnic Background | Number of Students |
|---|---|
| Asian | 19 |
| Black or African American | 33 |
| Hispanic or Latino | 133 |
| White | 667 |
| Non-Resident Aliens | 0 |
| Other Races | 51 |
