ONU total enrollment is approximately 2,817 students. 2,037 are undergraduates and 681 are graduate students.
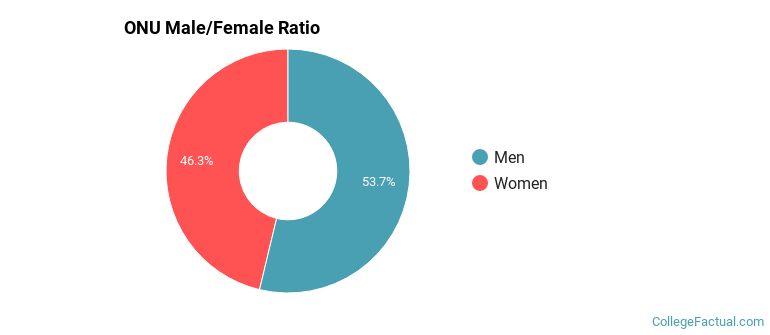
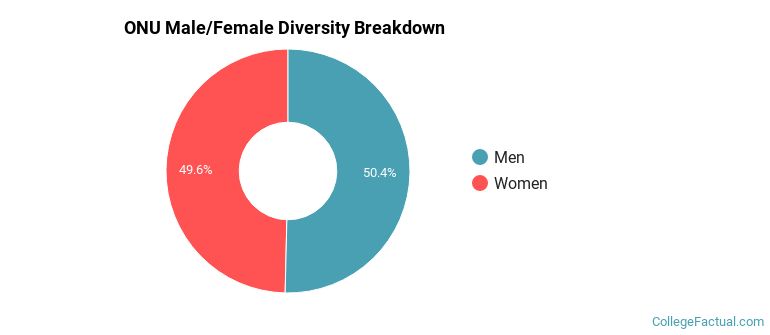
Male/Female Breakdown of Undergraduates
The full-time ONU undergraduate population is made up of 44% women, and 56% men.
For the gender breakdown for all students, go here.
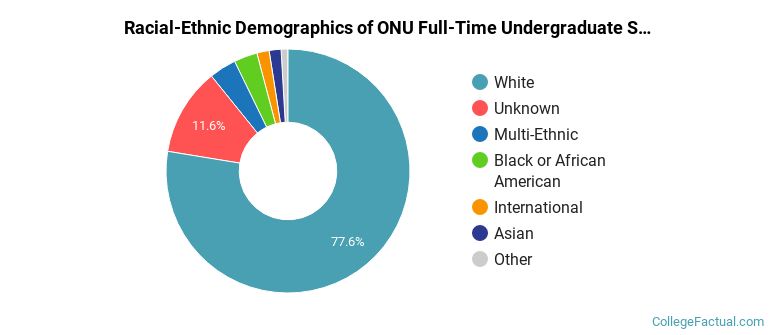
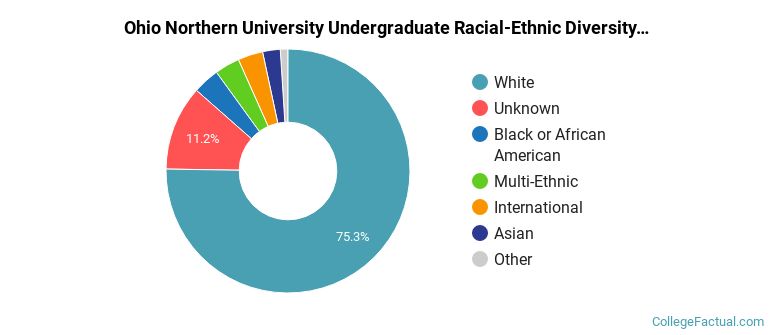
ONU Racial/Ethnic Breakdown of Undergraduates
| Race/Ethnicity | Number |
|---|---|
| White | 1,591 |
| Unknown | 225 |
| Multi-Ethnic | 88 |
| Black or African American | 66 |
| Asian | 30 |
| International | 18 |
| Hispanic | 12 |
| Native Hawaiian or Pacific Islander | 4 |
See racial/ethnic breakdown for all students.
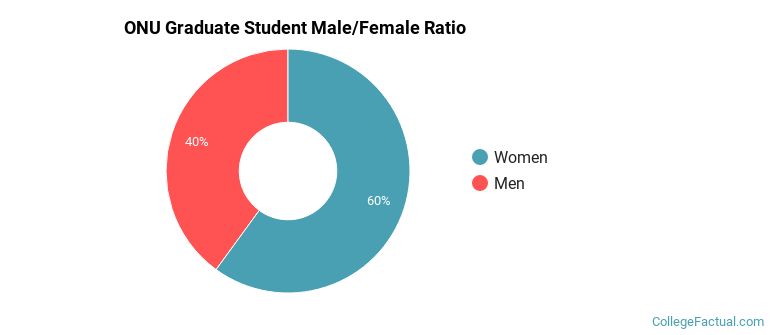
Male/Female Breakdown of Graduate Students
About 59% of full-time grad students are women, and 41% men.
For the gender breakdown for all students, go here.
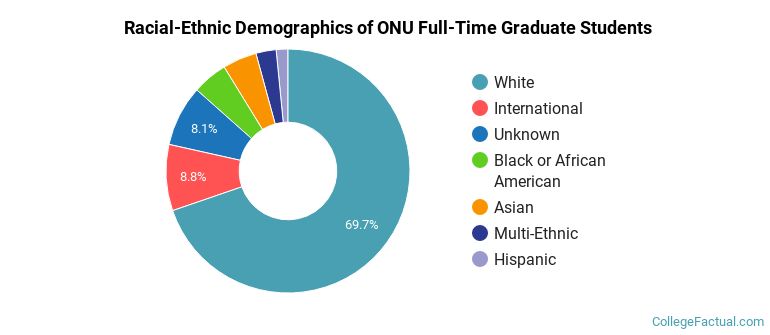
ONU Racial-Ethnic Breakdown of Graduate Students
| Race/Ethnicity | Number |
|---|---|
| White | 476 |
| Unknown | 64 |
| International | 42 |
| Asian | 35 |
| Black or African American | 30 |
| Multi-Ethnic | 21 |
| Hispanic | 10 |
| Native Hawaiian or Pacific Islander | 1 |
See racial/ethnic breakdown for all students.
| Race/Ethnicity | Number |
|---|---|
| White | 2,143 |
| Unknown | 302 |
| Multi-Ethnic | 112 |
| Black or African American | 99 |
| Asian | 67 |
| International | 62 |
| Hispanic | 22 |
| Native Hawaiian or Pacific Islander | 5 |
There are approximately 1,353 female students and 1,464 male students at ONU.
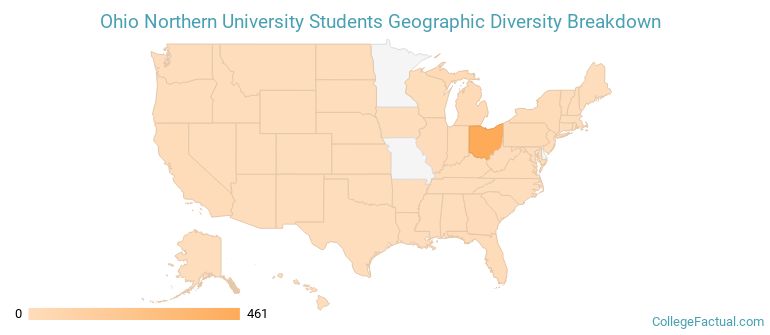
ONU ranks 893 out of 2,183 when it comes to geographic diversity.
22.39% of ONU students come from out of state, and 0.67% come from out of the country.
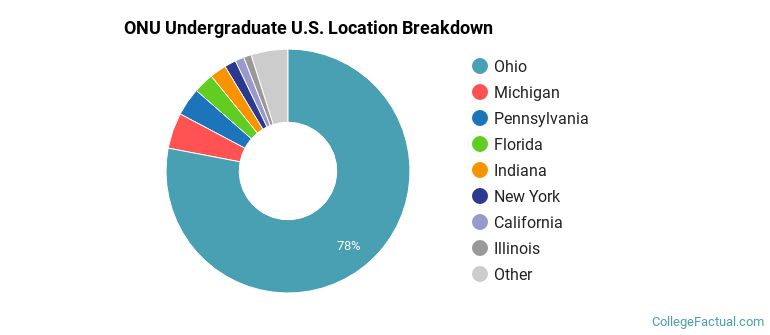
The undergraduate student body is split among 24 states (may include Washington D.C.). Click on the map for more detail.
| State | Amount |
|---|---|
| Ohio | 461 |
| Michigan | 28 |
| Pennsylvania | 22 |
| Florida | 16 |
| Indiana | 13 |
Students from 20 countries are represented at this school, with the majority of the international students coming from Japan, Saudi Arabia, and China.
Learn more about international students at ONU.
A traditional college student is defined as being between the ages of 18-21. At ONU, 68.10% of students fall into that category, compared to the national average of 60%.
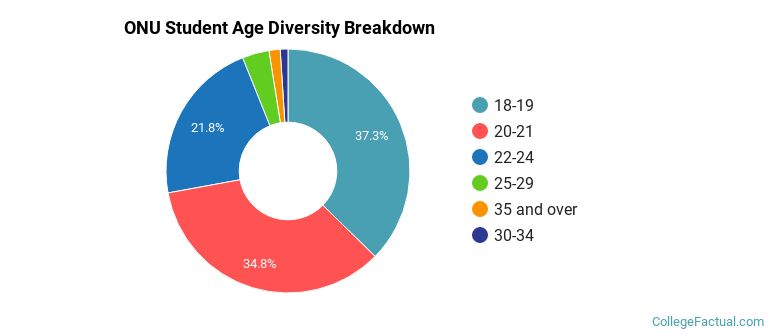
| Student Age Group | Amount |
|---|---|
| 18-19 | 1,089 |
| 20-21 | 1,014 |
| 22-24 | 636 |
| 25-29 | 104 |
| 35 and over | 43 |
| 30-34 | 30 |
| Under 18 | 0 |
Footnotes
*The racial-ethnic minorities count is calculated by taking the total number of students and subtracting white students, international students, and students whose race/ethnicity was unknown. This number is then divided by the total number of students at the school to obtain the racial-ethnic minorities percentage.
References