OC total enrollment is approximately 2,055 students. 1,538 are undergraduates and 131 are graduate students.
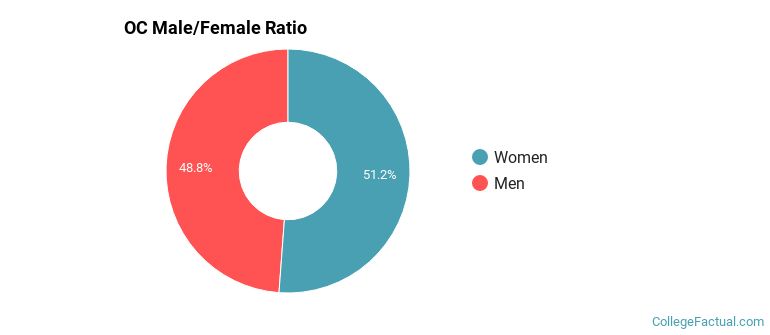
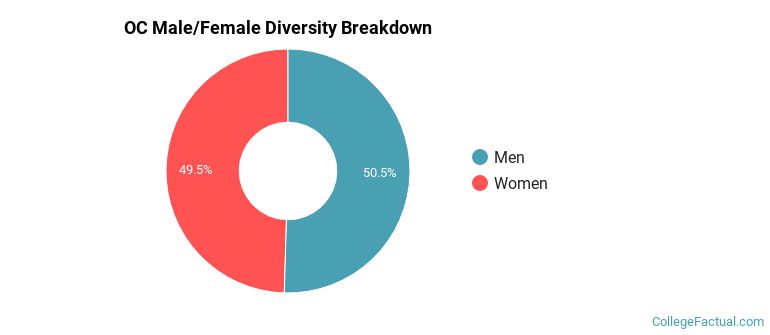
Male/Female Breakdown of Undergraduates
The full-time OC undergraduate population is made up of 51% women, and 49% men.
For the gender breakdown for all students, go here.
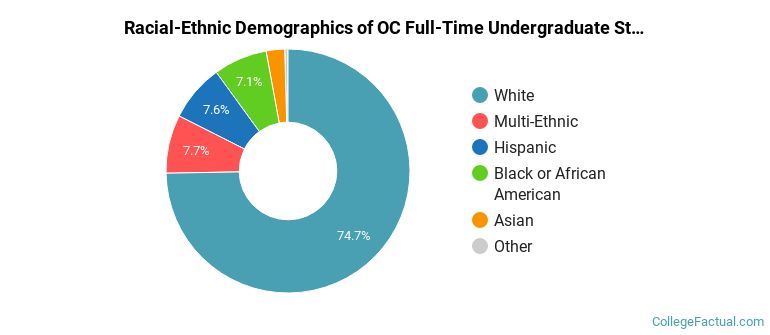
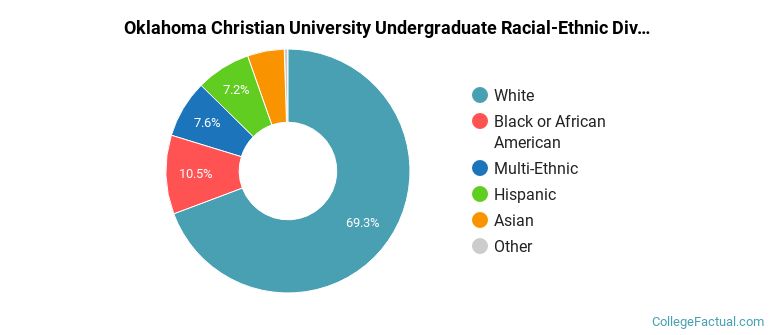
OC Racial/Ethnic Breakdown of Undergraduates
| Race/Ethnicity | Number |
|---|---|
| White | 1,115 |
| Multi-Ethnic | 123 |
| Black or African American | 116 |
| Hispanic | 115 |
| Asian | 31 |
| Unknown | 3 |
| Native Hawaiian or Pacific Islander | 1 |
| International | 0 |
See racial/ethnic breakdown for all students.
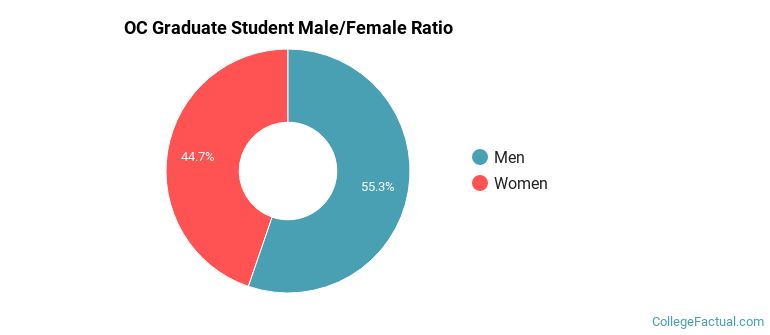
Male/Female Breakdown of Graduate Students
About 40% of full-time grad students are women, and 60% men.
For the gender breakdown for all students, go here.
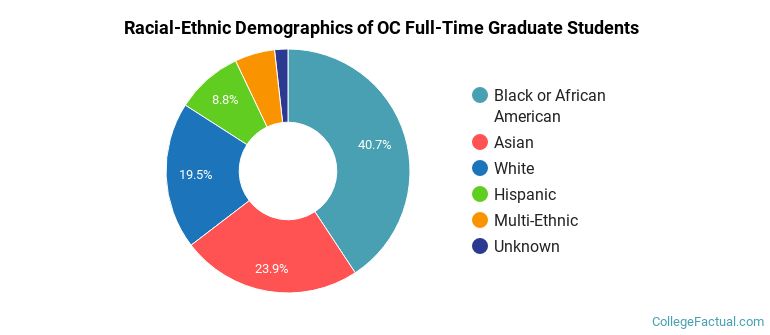
OC Racial-Ethnic Breakdown of Graduate Students
| Race/Ethnicity | Number |
|---|---|
| Black or African American | 53 |
| White | 33 |
| Asian | 29 |
| Hispanic | 11 |
| Multi-Ethnic | 3 |
| Native Hawaiian or Pacific Islander | 1 |
| Unknown | 1 |
| International | 0 |
See racial/ethnic breakdown for all students.
| Race/Ethnicity | Number |
|---|---|
| White | 1,388 |
| Black or African American | 220 |
| Hispanic | 155 |
| Multi-Ethnic | 147 |
| Asian | 87 |
| Unknown | 14 |
| Native Hawaiian or Pacific Islander | 2 |
| International | 0 |
There are approximately 1,015 female students and 1,040 male students at OC.
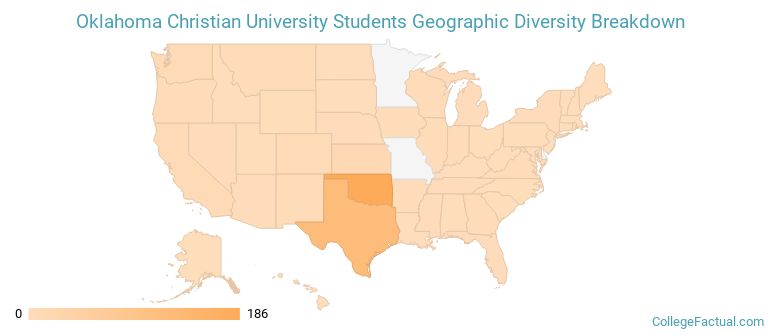
OC ranks 313 out of 2,183 when it comes to geographic diversity.
57.08% of OC students come from out of state, and 3.3% come from out of the country.
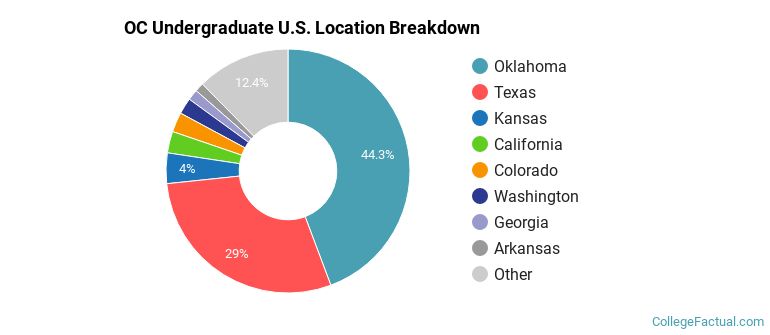
The undergraduate student body is split among 33 states (may include Washington D.C.). Click on the map for more detail.
| State | Amount |
|---|---|
| Oklahoma | 186 |
| Texas | 122 |
| Kansas | 17 |
| California | 12 |
| Colorado | 11 |
A traditional college student is defined as being between the ages of 18-21. At OC, 59.80% of students fall into that category, compared to the national average of 60%.
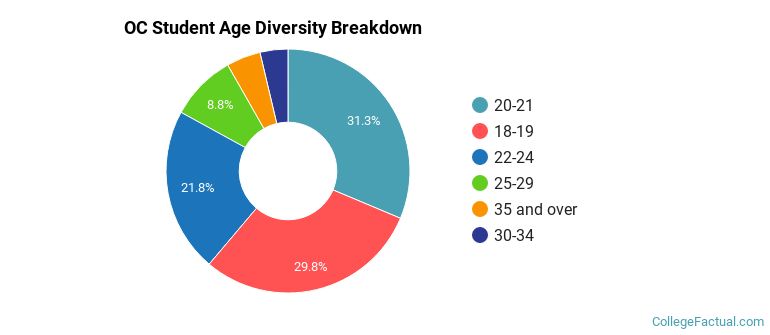
| Student Age Group | Amount |
|---|---|
| 20-21 | 753 |
| 18-19 | 717 |
| 22-24 | 524 |
| 25-29 | 211 |
| 35 and over | 109 |
| 30-34 | 89 |
| Under 18 | 0 |
Footnotes
*The racial-ethnic minorities count is calculated by taking the total number of students and subtracting white students, international students, and students whose race/ethnicity was unknown. This number is then divided by the total number of students at the school to obtain the racial-ethnic minorities percentage.
References
Department of Homeland Security Citizenship and Immigration Services
Learn more about how College Factual creates their Diversity Rankings.