Here, you'll find out more about the major, including such details as the number of graduates, what degree levels are offered, ethnicity of students, average salaries, and more. We've also included details on how OSU ranks compared to other colleges offering a major in accounting.
Jump to any of the following sections:
The bachelor's program at OSU was ranked #152 on College Factual's Best Schools for accounting list. It is also ranked #2 in Oklahoma.
| Ranking Type | Rank |
|---|---|
| Best Accounting Master’s Degree Schools | 120 |
| Best Accounting Graduate Degree Schools | 126 |
| Best Accounting Bachelor’s Degree Schools | 130 |
| Best Accounting Schools | 152 |
During the 2021-2022 academic year, Oklahoma State University - Main Campus handed out 171 bachelor's degrees in accounting. This is a decrease of 12% over the previous year when 194 degrees were handed out.
In 2022, 56 students received their master’s degree in accounting from OSU. This makes it the #88 most popular school for accounting master’s degree candidates in the country.
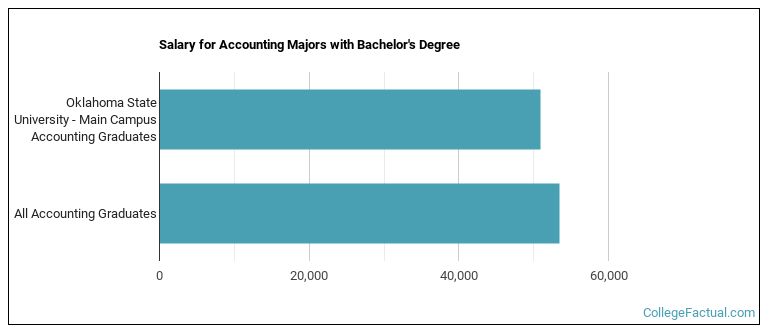
Accounting majors who earn their bachelor's degree from OSU go on to jobs where they make a median salary of $50,943 a year. This is less than $53,483, which is the national median of all accounting majors in the nation who earn bachelor's degrees.
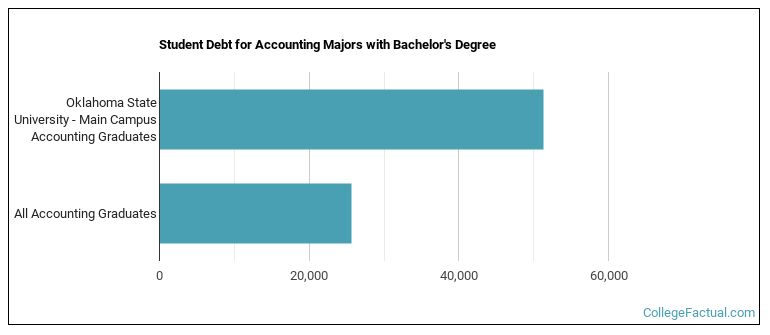
While getting their bachelor's degree at OSU, accounting students borrow a median amount of $51,292 in student loans. This is higher than the the typical median of $25,621 for all accounting majors across the country.
The typical student loan payment of a bachelor's degree student from the accounting program at OSU is $549 per month.
During the 2022-2023 academic year, part-time undergraduate students at OSU paid an average of $698 per credit hour if they came to the school from out-of-state. In-state students paid a discounted rate of $181 per credit hour. The following table shows the average full-time tuition and fees for undergraduates.
| In State | Out of State | |
|---|---|---|
| Tuition | $5,417 | $20,937 |
| Fees | $4,693 | $4,693 |
| Books and Supplies | $1,300 | $1,300 |
| On Campus Room and Board | $11,300 | $11,300 |
| On Campus Other Expenses | $5,400 | $5,400 |
Learn more about OSU tuition and fees.
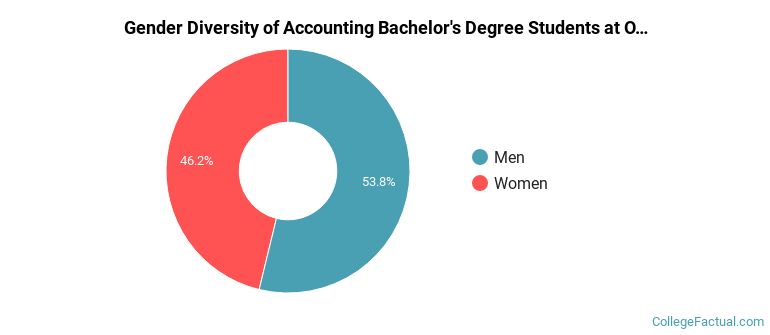
Of the 171 accounting students who graduated with a bachelor's degree in 2021-2022 from OSU, about 54% were men and 46% were women.
The majority of bachelor's degree recipients in this major at OSU are white. In the most recent graduating class for which data is available, 68% of students fell into this category.
The following table and chart show the ethnic background for students who recently graduated from Oklahoma State University - Main Campus with a bachelor's in accounting.
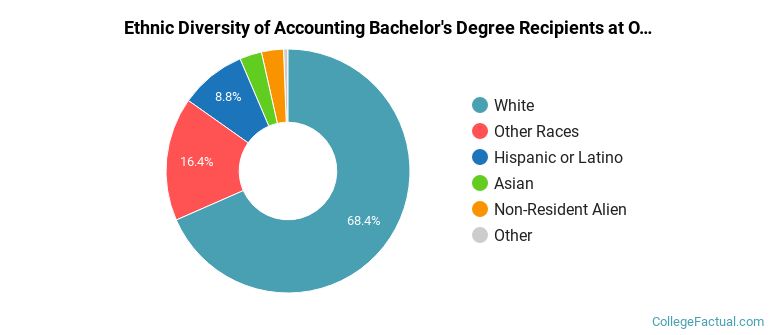
| Ethnic Background | Number of Students |
|---|---|
| Asian | 5 |
| Black or African American | 1 |
| Hispanic or Latino | 15 |
| White | 117 |
| Non-Resident Aliens | 5 |
| Other Races | 28 |
Online degrees for the OSU accounting bachelor’s degree program are not available at this time. To see if the school offers distance learning options in other areas, visit the OSU Online Learning page.
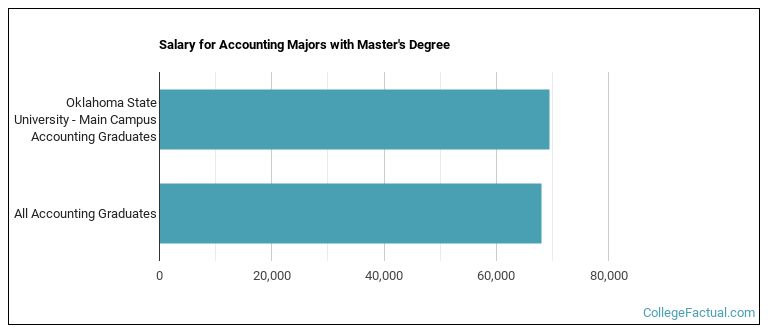
Accounting majors graduating with a master's degree from OSU make a median salary of $69,399 a year. This is a better than average outcome since the median salary for all accounting graduates with a master's is $68,141.
During the 2021-2022 academic year, 35 students graduated with a master's degree in accounting from OSU. About 60% were men and 40% were women.

The majority of the students with this major are white. About 71% of 2022 graduates were in this category.
The following table and chart show the ethnic background for students who recently graduated from Oklahoma State University - Main Campus with a master's in accounting.
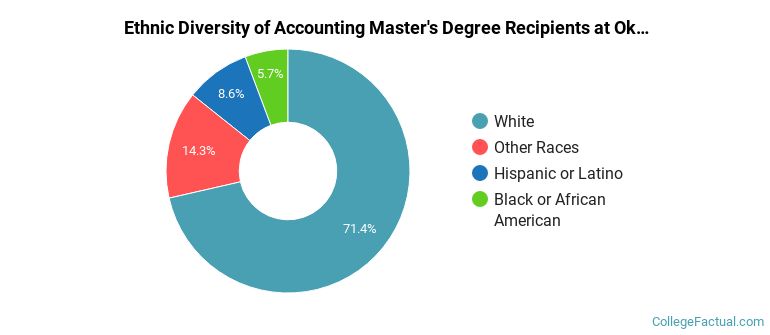
| Ethnic Background | Number of Students |
|---|---|
| Asian | 0 |
| Black or African American | 2 |
| Hispanic or Latino | 3 |
| White | 25 |
| Non-Resident Aliens | 0 |
| Other Races | 5 |
Take a look at the following statistics related to the make-up of the accounting majors at Oklahoma State University - Main Campus.
| Related Major | Annual Graduates |
|---|---|
| Business Administration & Management | 604 |
| Marketing | 336 |
| Finance & Financial Management | 196 |
| Entrepreneurial Studies | 57 |
| Hospitality Management | 48 |
More about our data sources and methodologies.