Olivet Nazarene total enrollment is approximately 3,764 students. 2,562 are undergraduates and 70 are graduate students.
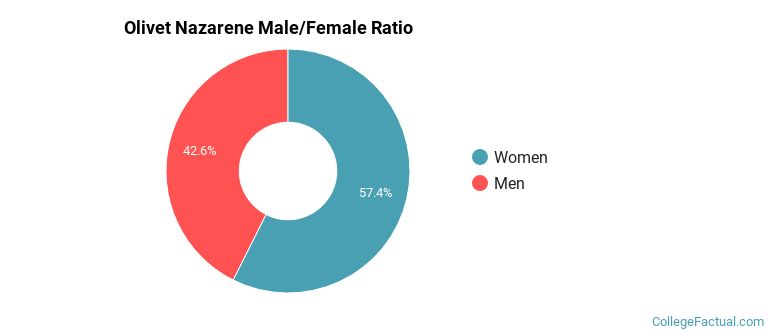
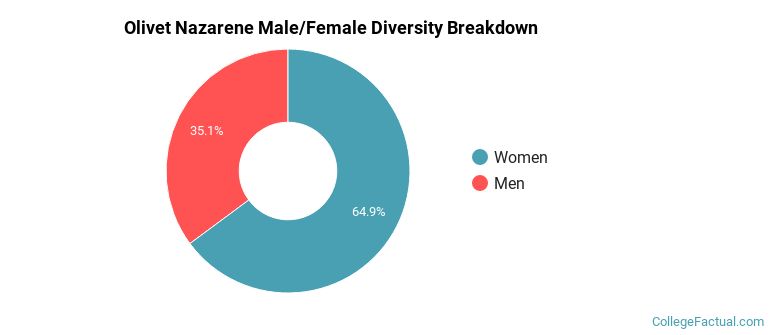
Male/Female Breakdown of Undergraduates
The full-time Olivet Nazarene undergraduate population is made up of 58% women, and 42% men.
For the gender breakdown for all students, go here.
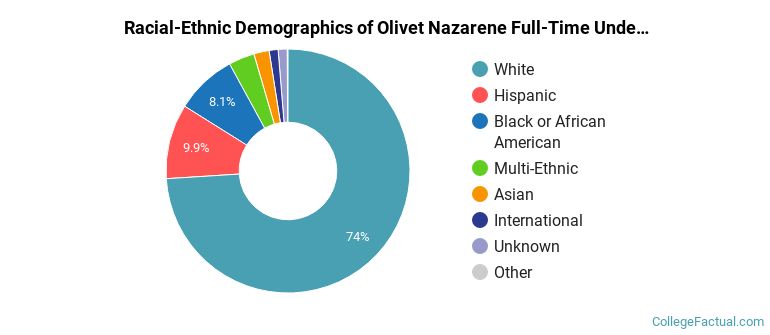
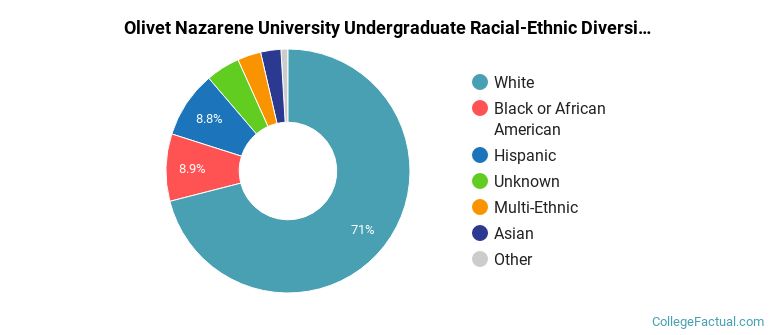
Olivet Nazarene Racial/Ethnic Breakdown of Undergraduates
| Race/Ethnicity | Number |
|---|---|
| White | 1,860 |
| Hispanic | 297 |
| Black or African American | 192 |
| Multi-Ethnic | 94 |
| Asian | 58 |
| International | 29 |
| Unknown | 24 |
| Native Hawaiian or Pacific Islander | 3 |
See racial/ethnic breakdown for all students.
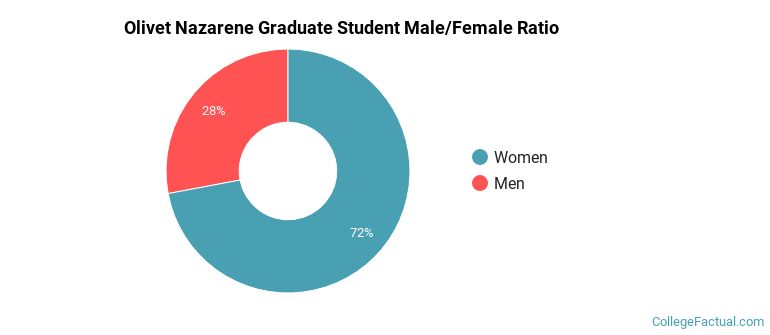
Male/Female Breakdown of Graduate Students
About 64% of full-time grad students are women, and 36% men.
For the gender breakdown for all students, go here.
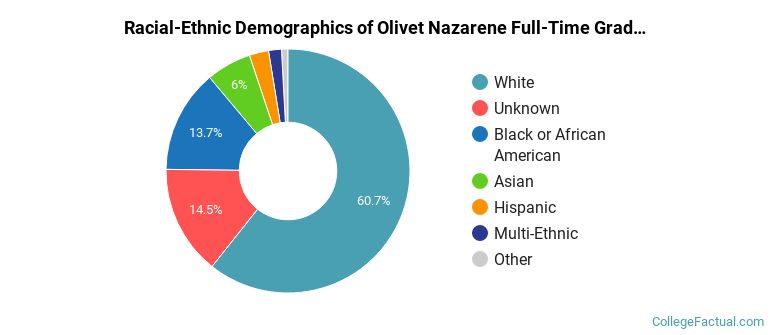
Olivet Nazarene Racial-Ethnic Breakdown of Graduate Students
| Race/Ethnicity | Number |
|---|---|
| White | 46 |
| Black or African American | 10 |
| Unknown | 7 |
| Asian | 4 |
| Hispanic | 2 |
| International | 1 |
| Native Hawaiian or Pacific Islander | 0 |
| Multi-Ethnic | 0 |
See racial/ethnic breakdown for all students.
| Race/Ethnicity | Number |
|---|---|
| White | 2,650 |
| Hispanic | 381 |
| Black or African American | 310 |
| Unknown | 158 |
| Multi-Ethnic | 119 |
| Asian | 101 |
| International | 32 |
| Native Hawaiian or Pacific Islander | 4 |
There are approximately 2,395 female students and 1,369 male students at Olivet Nazarene.
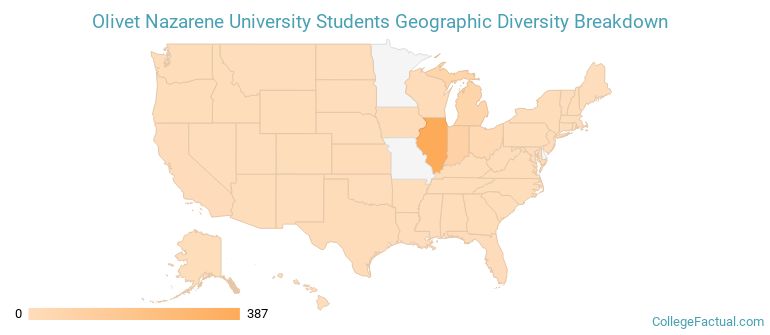
Olivet Nazarene ranks 427 out of 2,183 when it comes to geographic diversity.
44.32% of Olivet Nazarene students come from out of state, and 1.28% come from out of the country.
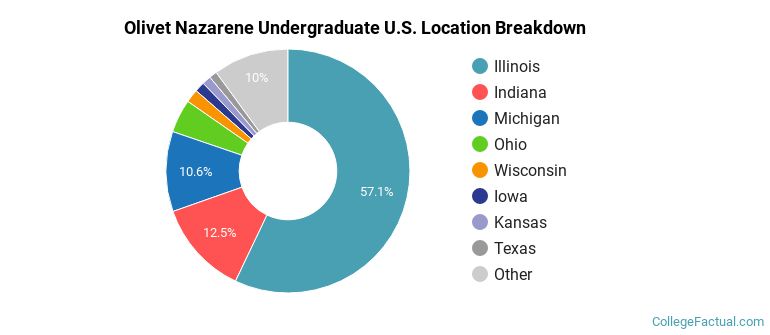
The undergraduate student body is split among 35 states (may include Washington D.C.). Click on the map for more detail.
| State | Amount |
|---|---|
| Illinois | 387 |
| Indiana | 85 |
| Michigan | 72 |
| Ohio | 30 |
| Wisconsin | 12 |
Students from 24 countries are represented at this school, with the majority of the international students coming from Spain, Canada, and Brazil.
Learn more about international students at Olivet Nazarene.
A traditional college student is defined as being between the ages of 18-21. At Olivet Nazarene, 50.48% of students fall into that category, compared to the national average of 60%.
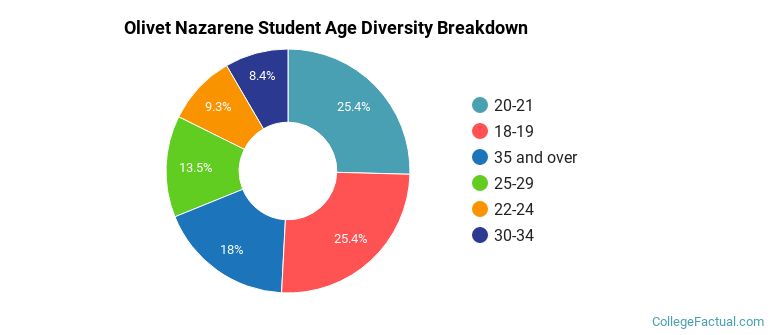
| Student Age Group | Amount |
|---|---|
| 20-21 | 1,259 |
| 18-19 | 1,258 |
| 35 and over | 893 |
| 25-29 | 666 |
| 22-24 | 459 |
| 30-34 | 416 |
| Under 18 | 0 |
Footnotes
*The racial-ethnic minorities count is calculated by taking the total number of students and subtracting white students, international students, and students whose race/ethnicity was unknown. This number is then divided by the total number of students at the school to obtain the racial-ethnic minorities percentage.
References