We've pulled together some essential information you should know about the program, including how many students graduate each year, the ethnic diversity of these students, and more. Also, learn how OCC ranks among other schools offering degrees in audiovisual.
Go directly to any of the following sections:
Learn about start dates, transferring credits, availability of financial aid, and more by contacting the universities below.
With an online bachelor's degree in communication you'll have the opportunity to pursue a multitude of career options. From journalism and social media, to public relations, advertising and mass media, earning your BA in communication will allow you to strategize and communicate your ideas.
BA in Communication - New Media
Explore the digital frontier as it relates to today's communications strategies with this specialized online bachelor's from Southern New Hampshire University.
Effective communicators are always in demand, no matter the industry. The Master's in Communication degree from Southern New Hampshire University is a cutting-edge program designed for forward-thinking professionals.
The audiovisual major at OCC is not ranked on College Factual’s Best Colleges and Universities for Audiovisual Communications. This could be for a number of reasons, such as not having enough data on the major or school to make an accurate assessment of its quality.
During the 2022-2023 academic year, part-time undergraduate students at OCC paid an average of $440 per credit hour if they came to the school from out-of-state. In-state students paid a discounted rate of $220 per credit hour. Information about average full-time undergraduate tuition and fees is shown in the table below.
| In State | Out of State | |
|---|---|---|
| Tuition | $5,290 | $10,580 |
| Fees | $752 | $752 |
| Books and Supplies | $700 | $700 |
| On Campus Room and Board | $11,258 | $11,258 |
| On Campus Other Expenses | $3,200 | $3,200 |
Learn more about OCC tuition and fees.
Online degrees for the OCC audiovisual bachelor’s degree program are not available at this time. To see if the school offers distance learning options in other areas, visit the OCC Online Learning page.
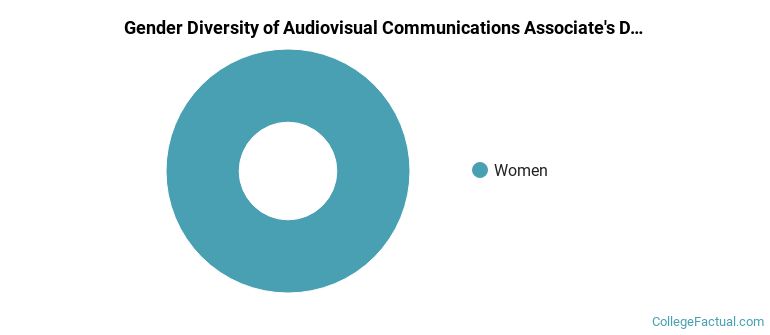
All of the 2 students who graduated with a Associate’s in audiovisual from OCC in 2022 were women.
The following table and chart show the ethnic background for students who recently graduated from Onondaga Community College with a associate's in audiovisual.
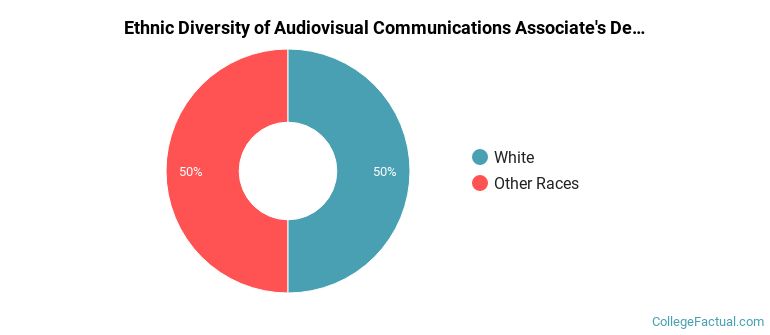
| Ethnic Background | Number of Students |
|---|---|
| Asian | 0 |
| Black or African American | 0 |
| Hispanic or Latino | 0 |
| White | 1 |
| Non-Resident Aliens | 0 |
| Other Races | 1 |
