Ottawa University - Surprise total enrollment is approximately 831 students. 648 are undergraduates and 30 are graduate students.
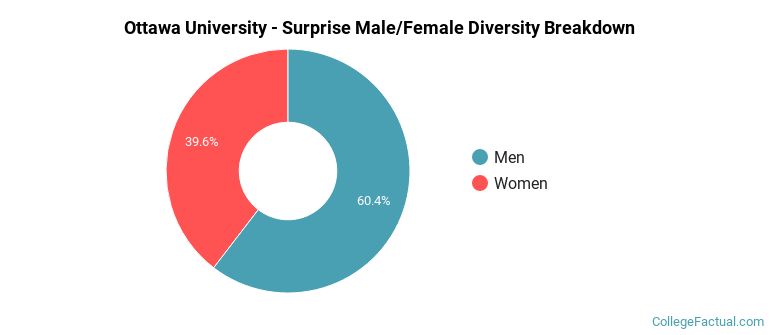
Male/Female Breakdown of Undergraduates
The full-time Ottawa University - Surprise undergraduate population is made up of 40% women, and 60% men.
For the gender breakdown for all students, go here.
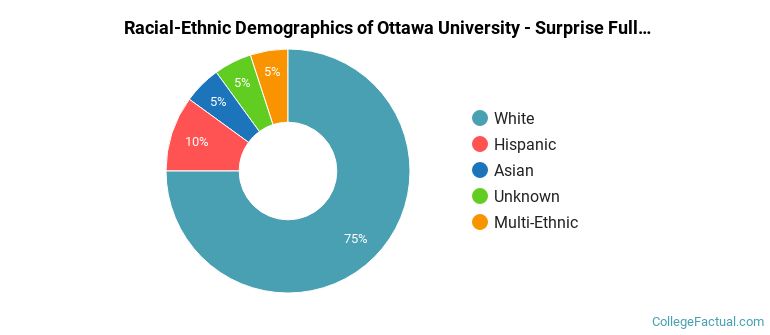
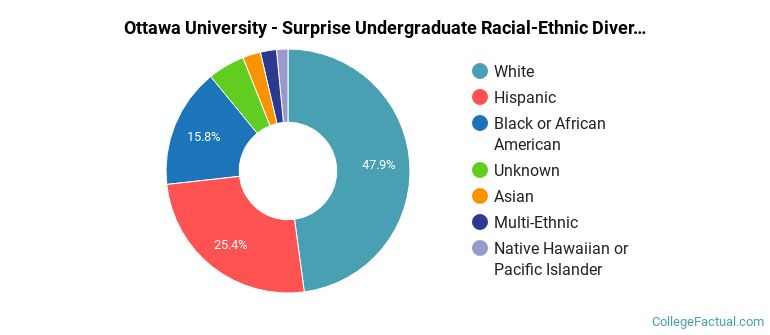
Ottawa University - Surprise Racial/Ethnic Breakdown of Undergraduates
| Race/Ethnicity | Number |
|---|---|
| White | 302 |
| Hispanic | 188 |
| Unknown | 74 |
| Black or African American | 54 |
| Asian | 16 |
| Multi-Ethnic | 5 |
| Native Hawaiian or Pacific Islander | 3 |
| International | 0 |
See racial/ethnic breakdown for all students.
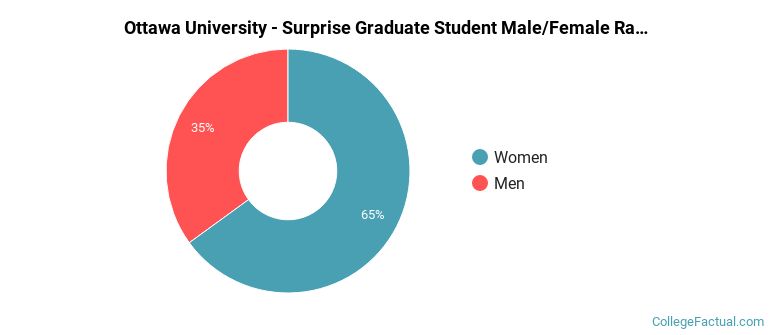
Male/Female Breakdown of Graduate Students
About 47% of full-time grad students are women, and 53% men.
For the gender breakdown for all students, go here.
Ottawa University - Surprise Racial-Ethnic Breakdown of Graduate Students
| Race/Ethnicity | Number |
|---|---|
| White | 20 |
| Hispanic | 4 |
| Black or African American | 2 |
| Multi-Ethnic | 2 |
| Unknown | 2 |
| Asian | 0 |
| Native Hawaiian or Pacific Islander | 0 |
| International | 0 |
See racial/ethnic breakdown for all students.
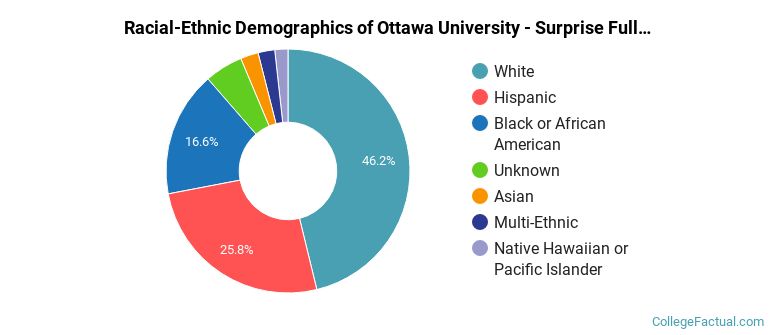
| Race/Ethnicity | Number |
|---|---|
| White | 395 |
| Hispanic | 222 |
| Unknown | 92 |
| Black or African American | 78 |
| Asian | 18 |
| Multi-Ethnic | 12 |
| Native Hawaiian or Pacific Islander | 7 |
| International | 0 |
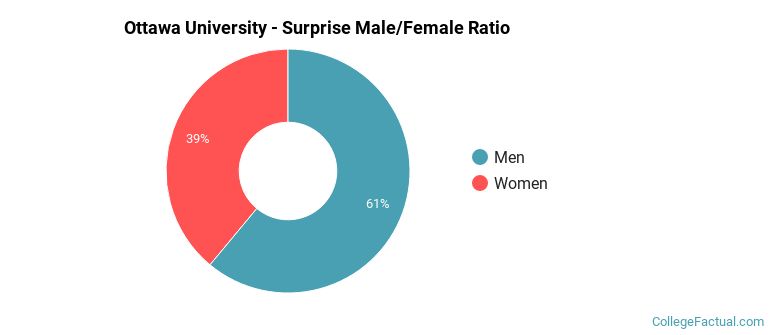
There are approximately 332 female students and 499 male students at Ottawa University - Surprise.
Footnotes
*The racial-ethnic minorities count is calculated by taking the total number of students and subtracting white students, international students, and students whose race/ethnicity was unknown. This number is then divided by the total number of students at the school to obtain the racial-ethnic minorities percentage.
References
Department of Homeland Security Citizenship and Immigration Services
Read College Factual's Diversity Ranking Methodology.