Here, you'll find out more about the major, including such details as the number of graduates, what degree levels are offered, ethnicity of students, and more. We've also included details on how OTC ranks compared to other colleges offering a major in biology.
Jump to any of the following sections:
The biology major at OTC is not ranked on College Factual’s Best Colleges and Universities for General Biology. This could be for a number of reasons, such as not having enough data on the major or school to make an accurate assessment of its quality.
Out-of-state part-time undergraduates at OTC paid an average of $240 per credit hour in 2022-2023. The average for in-state students was $188 per credit hour. Information about average full-time undergraduate tuition and fees is shown in the table below.
| In State | Out of State | |
|---|---|---|
| Tuition | $4,512 | $5,760 |
| Fees | $1,112 | $1,112 |
| Books and Supplies | $800 | $800 |
Learn more about OTC tuition and fees.
Online degrees for the OTC biology bachelor’s degree program are not available at this time. To see if the school offers distance learning options in other areas, visit the OTC Online Learning page.
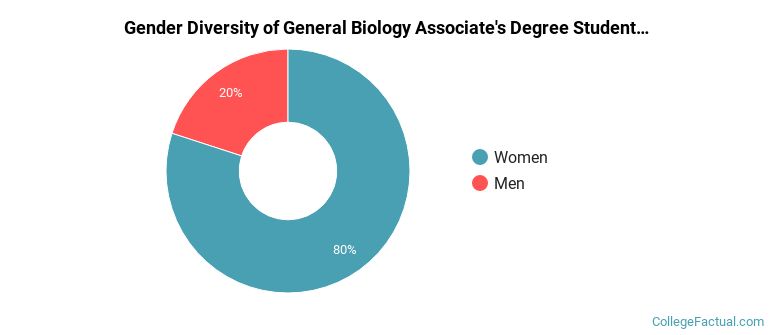
For the most recent academic year available, 20% of biology associate's degrees went to men and 80% went to women.
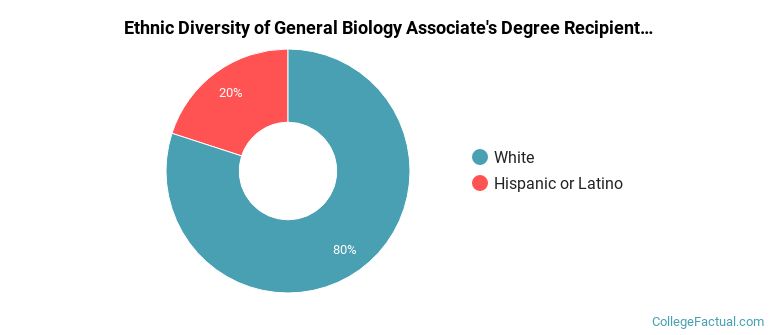
The majority of the students with this major are white. About 80% of 2022 graduates were in this category.
The following table and chart show the ethnic background for students who recently graduated from Ozarks Technical Community College with a associate's in biology.
| Ethnic Background | Number of Students |
|---|---|
| Asian | 0 |
| Black or African American | 0 |
| Hispanic or Latino | 2 |
| White | 8 |
| Non-Resident Aliens | 0 |
| Other Races | 0 |