PLU total enrollment is approximately 2,907 students. 2,486 are undergraduates and 259 are graduate students.
Male/Female Breakdown of Undergraduates
The full-time PLU undergraduate population is made up of 64% women, and 36% men.

For the gender breakdown for all students, go here.
PLU Racial/Ethnic Breakdown of Undergraduates

| Race/Ethnicity | Number |
|---|---|
| White | 1,406 |
| Hispanic | 344 |
| Multi-Ethnic | 271 |
| Asian | 265 |
| Black or African American | 91 |
| International | 36 |
| Unknown | 34 |
| Native Hawaiian or Pacific Islander | 33 |
See racial/ethnic breakdown for all students.
Male/Female Breakdown of Graduate Students
About 72% of full-time grad students are women, and 28% men.

For the gender breakdown for all students, go here.
PLU Racial-Ethnic Breakdown of Graduate Students

| Race/Ethnicity | Number |
|---|---|
| White | 149 |
| Asian | 31 |
| Multi-Ethnic | 24 |
| Black or African American | 20 |
| Hispanic | 19 |
| International | 10 |
| Unknown | 5 |
| Native Hawaiian or Pacific Islander | 1 |
See racial/ethnic breakdown for all students.

| Race/Ethnicity | Number |
|---|---|
| White | 1,651 |
| Hispanic | 379 |
| Asian | 310 |
| Multi-Ethnic | 305 |
| Black or African American | 119 |
| Unknown | 51 |
| International | 49 |
| Native Hawaiian or Pacific Islander | 37 |

There are approximately 1,889 female students and 1,018 male students at PLU.
PLU ranks 616 out of 2,183 when it comes to geographic diversity.
31.86% of PLU students come from out of state, and 0.88% come from out of the country.

The undergraduate student body is split among 23 states (may include Washington D.C.). Click on the map for more detail.
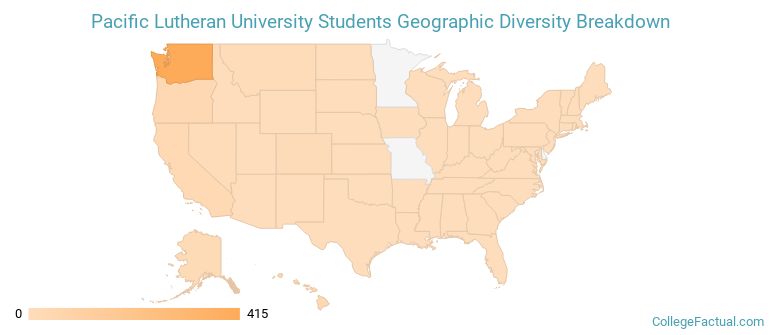
| State | Amount |
|---|---|
| Washington | 415 |
| Oregon | 41 |
| Hawaii | 39 |
| California | 32 |
| Alaska | 19 |
Students from 26 countries are represented at this school, with the majority of the international students coming from Norway, China, and Vietnam.
Learn more about international students at PLU.
A traditional college student is defined as being between the ages of 18-21. At PLU, 69.15% of students fall into that category, compared to the national average of 60%.

| Student Age Group | Amount |
|---|---|
| 18-19 | 1,147 |
| 20-21 | 1,012 |
| 22-24 | 352 |
| 35 and over | 218 |
| 25-29 | 205 |
| 30-34 | 154 |
| Under 18 | 0 |
Footnotes
*The racial-ethnic minorities count is calculated by taking the total number of students and subtracting white students, international students, and students whose race/ethnicity was unknown. This number is then divided by the total number of students at the school to obtain the racial-ethnic minorities percentage.
References
Department of Homeland Security Citizenship and Immigration Services
Find out how College Factual created their Diversity Rankings.