College Factual  by our College Data Analytics Team
       Unbiased Factual Guarantee

Paul Mitchell the School Louisville Data & Information Overview

Want the scoop on Paul Mitchell the School Louisville? We’ve put together a comprehensive report on the school that covers what majors Paul Mitchell the School Louisville offers, how the school ranks, how diverse it is, and much more. All you need to do to learn more about a stat is click on its tile, and you’ll be taken to another page that analyzes that data more closely. Also, you can use the links below to scroll to any section of this page.

How Well Is Paul Mitchell the School Louisville Ranked?

2025 Rankings

Explore Best Ranked Schools for You

Explore the best ranked schools for the programs you are most interested in.

Overall Quality

Paul Mitchell the School Louisville was not ranked in College Factual's Best Overall Colleges report this year. This may be because not enough data was available.

See all of the rankings for Paul Mitchell the School Louisville.

Is It Hard to Get Into Paul Mitchell the School Louisville?

Open Admissions Policy

Acceptance Rate

Paul Mitchell the School Louisville has an open admissions policy, so you should not have much trouble being accepted by the school. Still, it is important to fill out the application completely and submit any requested materials, which may include proof that you have a high school diploma or the equivalent.

Learn more about Paul Mitchell the School Louisville admissions.

Paul Mitchell the School Louisville Faculty

19 to 1 Student to Faculty

Student to Faculty Ratio

The student to faculty ratio at Paul Mitchell the School Louisville is 19 to 1, which is high when compared to the national average of 15 to 1. This may indicate that some of your classes will be larger in size than they would be at other schools. However, upper level classes will probably be smaller.

Retention and Graduation Rates at Paul Mitchell the School Louisville

63% Freshmen Retention

Freshmen Retention Rate

The freshmen retention rate tells us what percentage of first-year, full-time students choose to continue on to their sophomore year at a particular school. The rate at Paul Mitchell the School Louisville is 63%, which is about average when compared to the national rate of 68%.

Freshmen Retention Rate  63 out of 100
0
100

Find out more about the retention and graduation rates at Paul Mitchell the School Louisville.

Paul Mitchell the School Louisville Undergraduate Student Diversity

140 Full-Time Undergraduates
19.3% Racial-Ethnic Minorities*
92.9% Percent Women

During the 2017-2018 academic year, there were 207 undergraduates at Paul Mitchell the School Louisville with 140 being full-time and 67 being part-time.

How Much Does Paul Mitchell the School Louisville Cost?

$22,109 Net Price
77% Take Out Loans
$36,304 Total Student Loans
The overall average net price of Paul Mitchell the School Louisville is $22,109. The affordability of the school largely depends on your financial need since net price varies by income group. See the table below for the net price for different income groups.

Net Price by Income Group for Paul Mitchell the School Louisville

$0-30 K$30K-48K$48-75$75-110K$110K +
$19,161$20,924$21,929$25,045$25,045

The net price is calculated by adding tuition, room, board and other costs and subtracting financial aid.Note that the net price is typically less than the published for a school. For more information on the sticker price of Paul Mitchell the School Louisville, see our tuition and fees and room and board pages.

Student Loan Debt

While almost two-thirds of students nationwide take out loans to pay for college, the percentage may be quite different for the school you plan on attending. At Paul Mitchell the School Louisville, approximately 77% of students took out student loans averaging $9,076 a year. That adds up to $36,304 over four years for those students.

Get more details about paying for Paul Mitchell the School Louisville.

How Much Money Do Paul Mitchell the School Louisville Graduates Make?

$28,449 Avg Salary of Grads
High Earnings Boost
The pay for some majors is higher than others, but on average, students who graduate with a bachelor's degree from Paul Mitchell the School Louisville make about $28,449 a year during their first few years of employment after graduation. This is about 42% less that the average pay for college graduates overall. However, graduates with your major may make more.

undefined

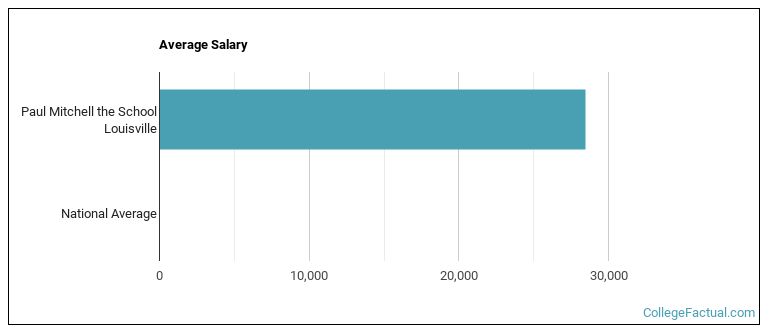
See which majors at Paul Mitchell the School Louisville make the most money.

Location of Paul Mitchell the School Louisville

Kentucky State
140 Full-Time Undergraduates
Suburb Campus Setting
Located in Louisville, Kentucky, Paul Mitchell the School Louisville is a private for-profit institution. Louisville is considered a suburb and offers tranquility and safety near the excitement of a city center.

Get more details about the location of Paul Mitchell the School Louisville.

undefined

Contact details for Paul Mitchell the School Louisville are given below.

Contact Details
Address:156 North Hurstbourne Parkway, Louisville, KY 40222
Phone:502-583-1018
Website:paulmitchell.edu/louisville

Paul Mitchell the School Louisville Majors

1 Majors With Completions
206 Undergraduate Degrees
206 Graduate Degrees
During the most recent year for which we have data, students from 1 majors graduated from Paul Mitchell the School Louisville. Of these students, 206 received undergraduate degrees and 206 graduated with a master's or doctor's degree. The following table lists the most popular undergraduate majors along with the average salary graduates from those majors make.

Most Popular MajorsBachelor’s DegreesAverage Salary of Graduates
Cosmetology103NA

Learn more about the majors offered at Paul Mitchell the School Louisville along with which ones have the highest average starting salaries.

Learn more about online learning at Paul Mitchell the School Louisville.

Notes and References

Footnotes

*The racial-ethnic minorities count is calculated by taking the total number of students and subtracting white students, international students, and students whose race/ethnicity was unknown. This number is then divided by the total number of students at the school to obtain the racial-ethnic minorities percentage.

References

More about our data sources and methodologies.

Popular Reports

College Rankings
Best by Location
Degree Guides by Major
Graduate Programs

Compare Your School Options