Here, you'll find out more about the major, including such details as the number of graduates, what degree levels are offered, ethnicity of students, average salaries, and more. Also, learn how Pitt State ranks among other schools offering degrees in subject specific ed.
Jump to any of the following sections:
The bachelor's program at Pitt State was ranked #109 on College Factual's Best Schools for subject specific ed list. It is also ranked #3 in Kansas.
During the 2021-2022 academic year, Pittsburg State University handed out 69 bachelor's degrees in teacher education subject specific. This is an increase of 15% over the previous year when 60 degrees were handed out.
In 2022, 42 students received their master’s degree in subject specific ed from Pitt State. This makes it the #107 most popular school for subject specific ed master’s degree candidates in the country.
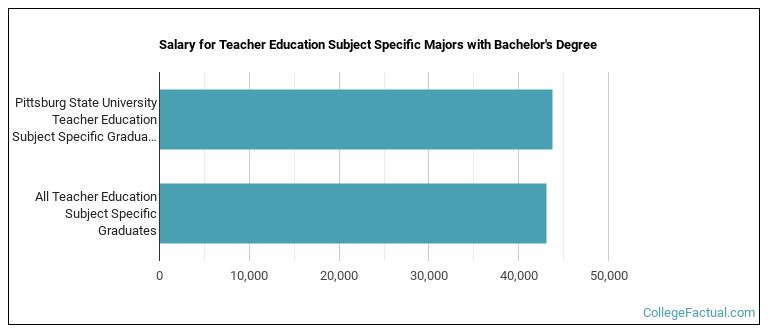
Subject Specific Ed majors who earn their bachelor's degree from Pitt State go on to jobs where they make a median salary of $43,802 a year. This is great news for graduates of the program, since this figure is higher than the national average of $43,086 for all subject specific ed bachelor's degree recipients.
During the 2022-2023 academic year, part-time undergraduate students at Pitt State paid an average of $582 per credit hour if they came to the school from out-of-state. In-state students paid a discounted rate of $204 per credit hour. Information about average full-time undergraduate tuition and fees is shown in the table below.
| In State | Out of State | |
|---|---|---|
| Tuition | $6,128 | $17,472 |
| Fees | $2,028 | $2,028 |
| Books and Supplies | $1,200 | $1,200 |
| On Campus Room and Board | $9,398 | $9,398 |
| On Campus Other Expenses | $5,396 | $5,396 |
Learn more about Pitt State tuition and fees.
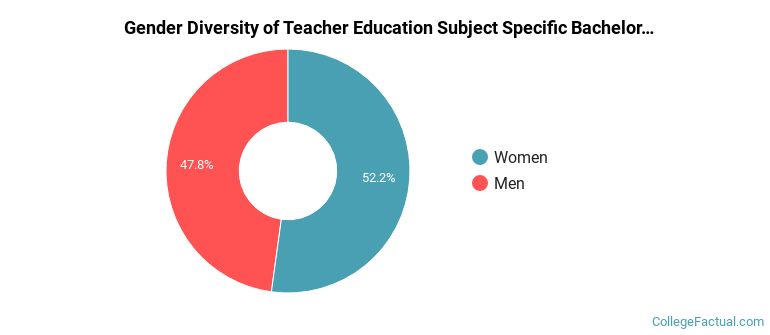
The subject specific ed program at Pitt State awarded 69 bachelor's degrees in 2021-2022. About 48% of these degrees went to men with the other 52% going to women.
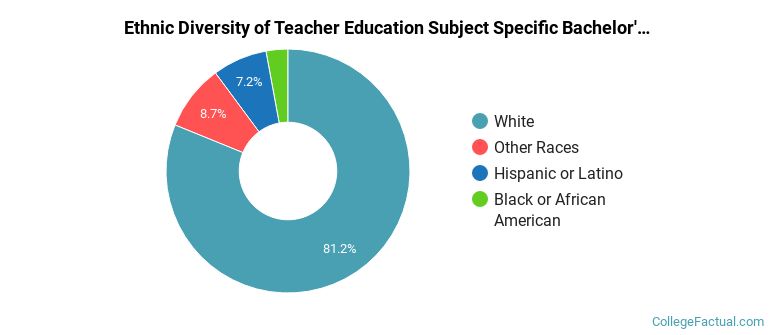
The majority of the students with this major are white. About 81% of 2022 graduates were in this category.
The following table and chart show the ethnic background for students who recently graduated from Pittsburg State University with a bachelor's in subject specific ed.
| Ethnic Background | Number of Students |
|---|---|
| Asian | 0 |
| Black or African American | 2 |
| Hispanic or Latino | 5 |
| White | 56 |
| Non-Resident Aliens | 0 |
| Other Races | 6 |
Online degrees for the Pitt State subject specific ed bachelor’s degree program are not available at this time. To see if the school offers distance learning options in other areas, visit the Pitt State Online Learning page.
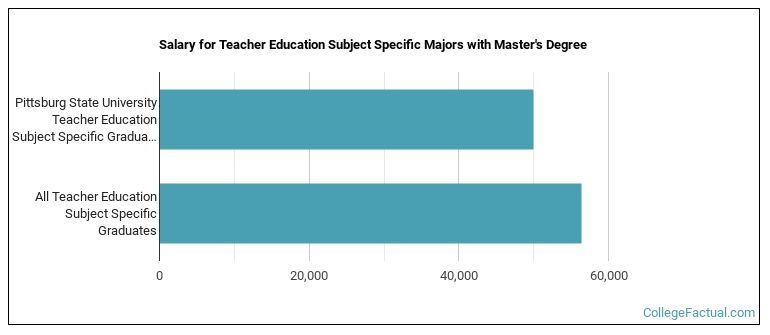
Subject Specific Ed majors graduating with a master's degree from Pitt State make a median salary of $50,043 a year. This is less than what their typical peers from other schools make. Their median salary is $56,457.
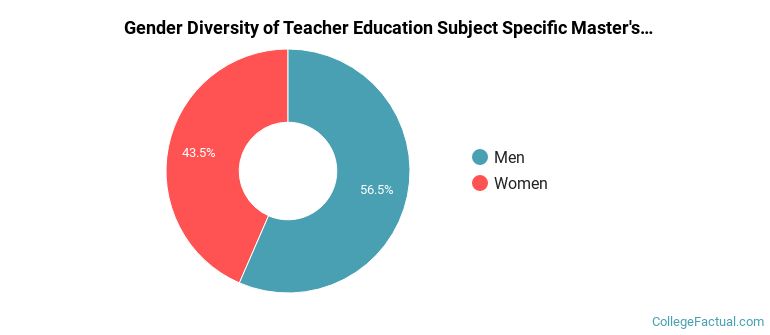
In the 2021-2022 academic year, 46 students earned a master's degree in subject specific ed from Pitt State. About 43% of these graduates were women and the other 57% were men.
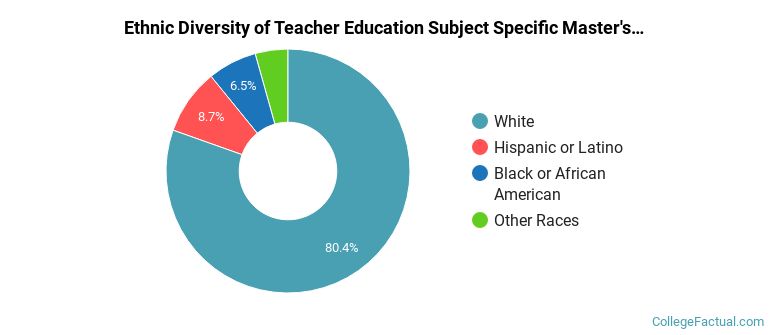
The majority of master's degree recipients in this major at Pitt State are white. In the most recent graduating class for which data is available, 80% of students fell into this category.
The following table and chart show the ethnic background for students who recently graduated from Pittsburg State University with a master's in subject specific ed.
| Ethnic Background | Number of Students |
|---|---|
| Asian | 0 |
| Black or African American | 3 |
| Hispanic or Latino | 4 |
| White | 37 |
| Non-Resident Aliens | 0 |
| Other Races | 2 |
Take a look at the following statistics related to the make-up of the subject specific ed majors at Pittsburg State University.
| Related Major | Annual Graduates |
|---|---|
| Teacher Education Grade Specific | 194 |
| Educational Administration | 71 |
| Instructional Media Design | 41 |
| Special Education | 39 |
| Student Counseling | 5 |
View All Teacher Education Subject Specific Related Majors >