PLNU total enrollment is approximately 4,616 students. 2,543 are undergraduates and 638 are graduate students.
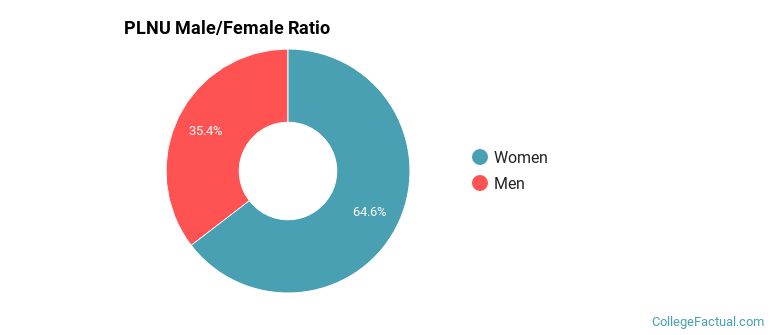
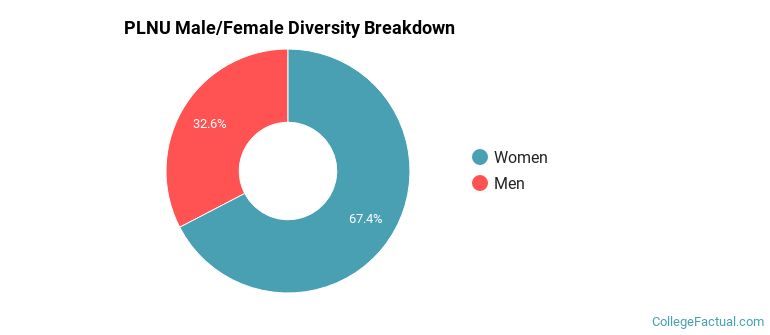
Male/Female Breakdown of Undergraduates
The full-time PLNU undergraduate population is made up of 66% women, and 34% men.
For the gender breakdown for all students, go here.
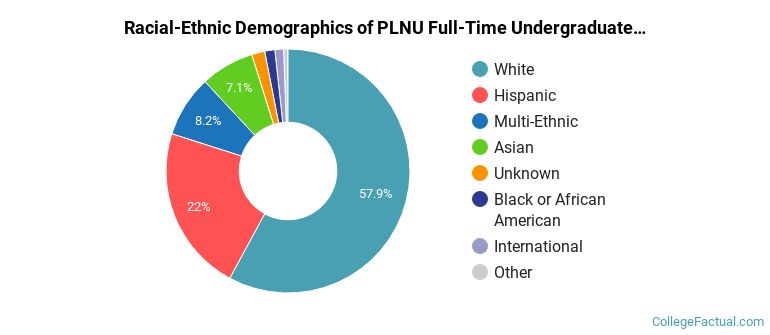
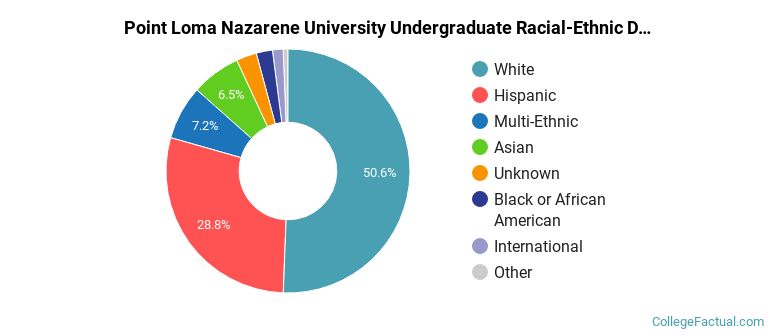
PLNU Racial/Ethnic Breakdown of Undergraduates
| Race/Ethnicity | Number |
|---|---|
| White | 1,457 |
| Hispanic | 573 |
| Multi-Ethnic | 230 |
| Asian | 171 |
| Black or African American | 39 |
| Unknown | 34 |
| International | 20 |
| Native Hawaiian or Pacific Islander | 8 |
See racial/ethnic breakdown for all students.
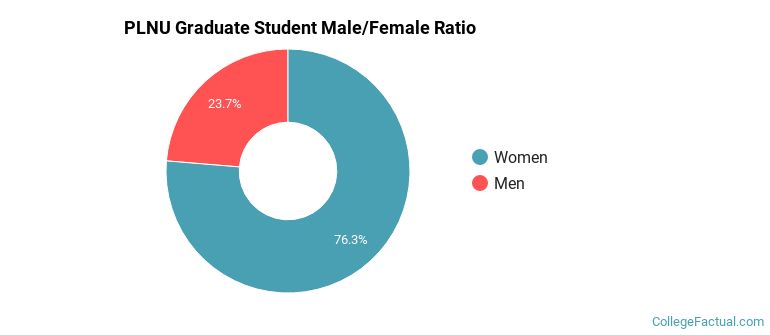
Male/Female Breakdown of Graduate Students
About 75% of full-time grad students are women, and 25% men.
For the gender breakdown for all students, go here.
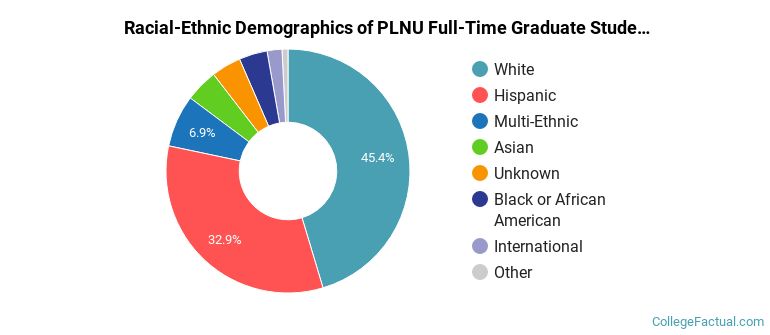
PLNU Racial-Ethnic Breakdown of Graduate Students
| Race/Ethnicity | Number |
|---|---|
| White | 291 |
| Hispanic | 219 |
| Multi-Ethnic | 43 |
| Asian | 41 |
| Black or African American | 21 |
| Unknown | 11 |
| International | 7 |
| Native Hawaiian or Pacific Islander | 5 |
See racial/ethnic breakdown for all students.
| Race/Ethnicity | Number |
|---|---|
| White | 2,319 |
| Hispanic | 1,391 |
| Multi-Ethnic | 333 |
| Asian | 302 |
| Black or African American | 101 |
| Unknown | 93 |
| International | 41 |
| Native Hawaiian or Pacific Islander | 22 |
There are approximately 3,161 female students and 1,455 male students at PLNU.
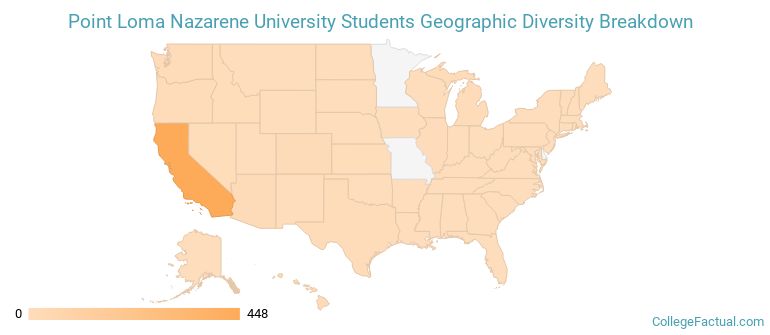
PLNU ranks 585 out of 2,183 when it comes to geographic diversity.
23.94% of PLNU students come from out of state, and 0.84% come from out of the country.
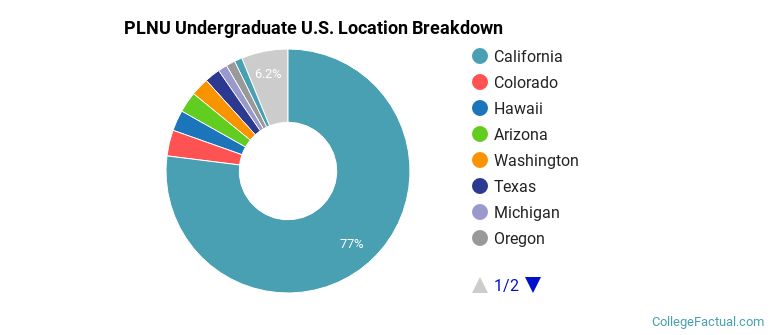
The undergraduate student body is split among 32 states (may include Washington D.C.). Click on the map for more detail.
| State | Amount |
|---|---|
| California | 448 |
| Colorado | 20 |
| Arizona | 16 |
| Hawaii | 16 |
| Washington | 14 |
Students from 32 countries are represented at this school, with the majority of the international students coming from China, Germany, and Canada.
Learn more about international students at PLNU.
A traditional college student is defined as being between the ages of 18-21. At PLNU, 50.08% of students fall into that category, compared to the national average of 60%.
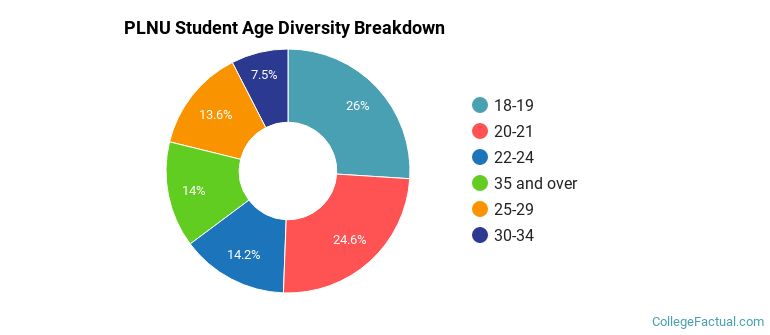
| Student Age Group | Amount |
|---|---|
| 18-19 | 1,137 |
| 20-21 | 1,075 |
| 22-24 | 621 |
| 35 and over | 614 |
| 25-29 | 595 |
| 30-34 | 330 |
| Under 18 | 0 |
Footnotes
*The racial-ethnic minorities count is calculated by taking the total number of students and subtracting white students, international students, and students whose race/ethnicity was unknown. This number is then divided by the total number of students at the school to obtain the racial-ethnic minorities percentage.
References
Department of Homeland Security Citizenship and Immigration Services
Image Credit: By OperaSmorg under License