Post University total enrollment is approximately 13,844 students. 3,609 are undergraduates and 739 are graduate students.
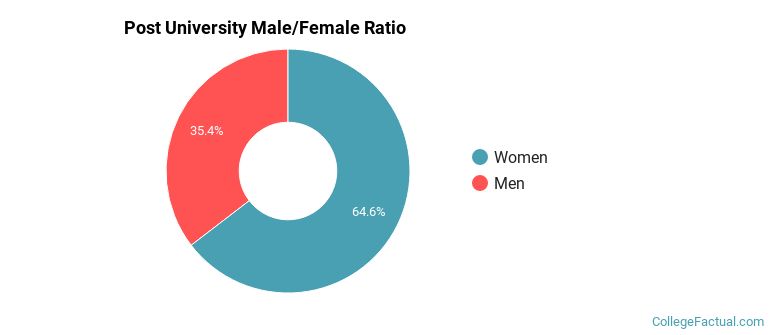
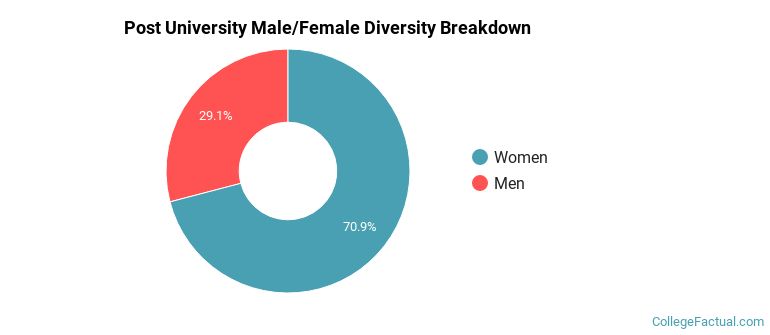
Male/Female Breakdown of Undergraduates
The full-time Post University undergraduate population is made up of 74% women, and 26% men.
For the gender breakdown for all students, go here.
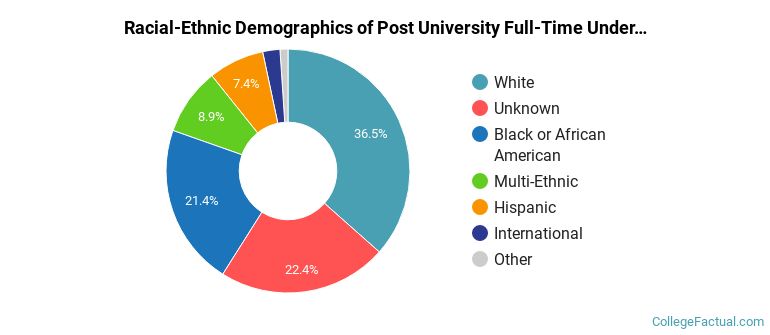
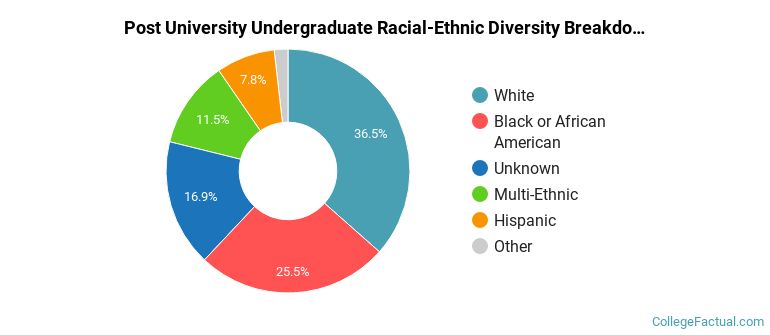
Post University Racial/Ethnic Breakdown of Undergraduates
| Race/Ethnicity | Number |
|---|---|
| White | 1,404 |
| Black or African American | 855 |
| Multi-Ethnic | 550 |
| Unknown | 385 |
| Hispanic | 321 |
| International | 32 |
| Asian | 21 |
| Native Hawaiian or Pacific Islander | 12 |
See racial/ethnic breakdown for all students.
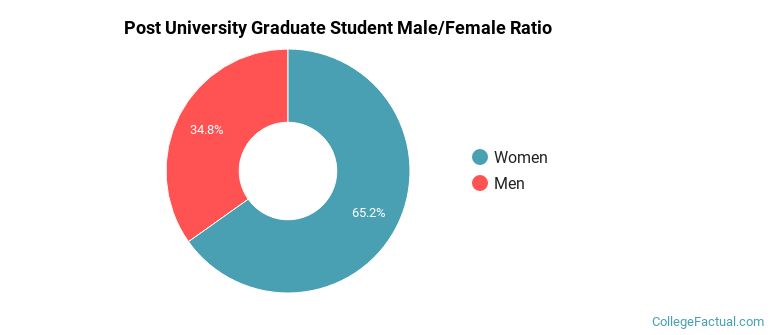
Male/Female Breakdown of Graduate Students
About 64% of full-time grad students are women, and 36% men.
For the gender breakdown for all students, go here.
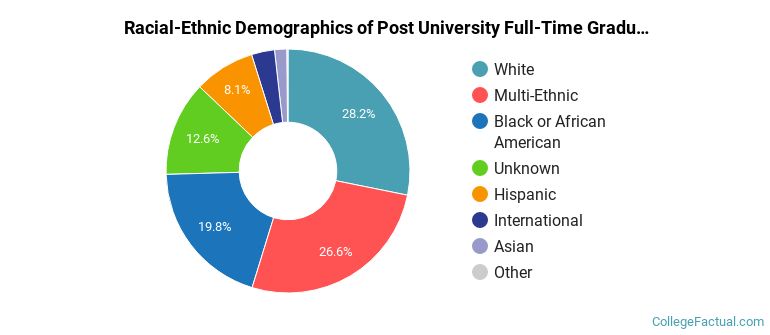
Post University Racial-Ethnic Breakdown of Graduate Students
| Race/Ethnicity | Number |
|---|---|
| Multi-Ethnic | 246 |
| White | 233 |
| Black or African American | 142 |
| Unknown | 56 |
| Hispanic | 43 |
| Asian | 11 |
| International | 3 |
| Native Hawaiian or Pacific Islander | 2 |
See racial/ethnic breakdown for all students.
| Race/Ethnicity | Number |
|---|---|
| White | 5,291 |
| Black or African American | 3,761 |
| Multi-Ethnic | 2,148 |
| Unknown | 1,195 |
| Hispanic | 1,105 |
| Asian | 122 |
| Native Hawaiian or Pacific Islander | 53 |
| International | 39 |
There are approximately 10,160 female students and 3,684 male students at Post University.
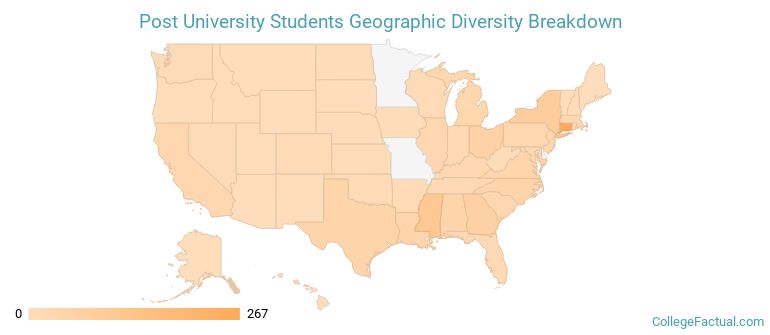
Post University ranks 73 out of 2,183 when it comes to geographic diversity.
79.87% of Post University students come from out of state, and 2.16% come from out of the country.
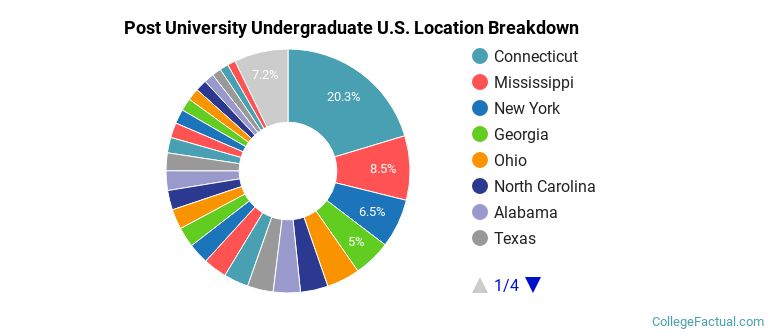
The undergraduate student body is split among 45 states (may include Washington D.C.). Click on the map for more detail.
| State | Amount |
|---|---|
| Connecticut | 267 |
| Mississippi | 112 |
| New York | 85 |
| Georgia | 65 |
| Ohio | 58 |
Students from 40 countries are represented at this school, with the majority of the international students coming from China, France, and Canada.
Learn more about international students at Post University.
A traditional college student is defined as being between the ages of 18-21. At Post University, 10.43% of students fall into that category, compared to the national average of 60%.
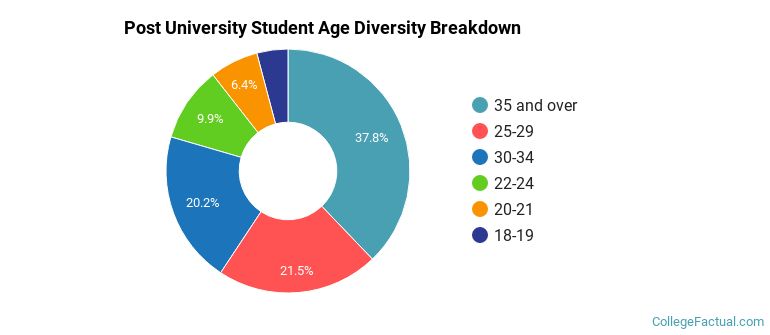
| Student Age Group | Amount |
|---|---|
| 35 and over | 3,193 |
| 25-29 | 1,811 |
| 30-34 | 1,705 |
| 22-24 | 838 |
| 20-21 | 543 |
| 18-19 | 348 |
| Under 18 | 0 |
Footnotes
*The racial-ethnic minorities count is calculated by taking the total number of students and subtracting white students, international students, and students whose race/ethnicity was unknown. This number is then divided by the total number of students at the school to obtain the racial-ethnic minorities percentage.
References