Providence total enrollment is approximately 4,821 students. 4,098 are undergraduates and 195 are graduate students.
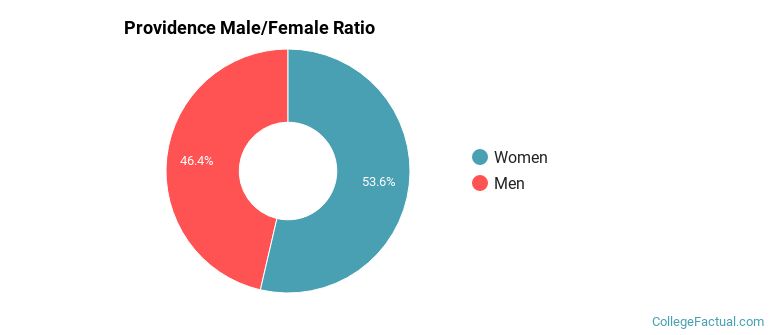
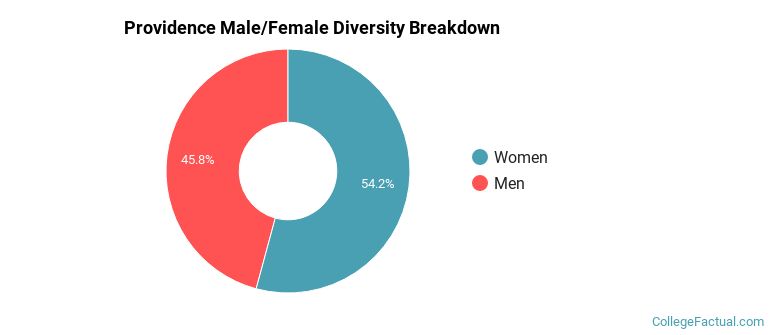
Male/Female Breakdown of Undergraduates
The full-time Providence undergraduate population is made up of 55% women, and 45% men.
For the gender breakdown for all students, go here.
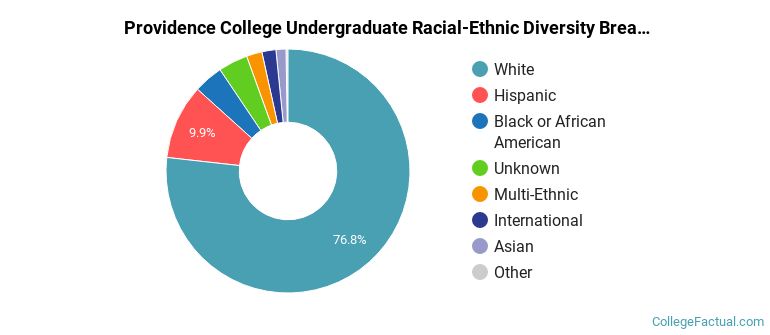
Providence Racial/Ethnic Breakdown of Undergraduates
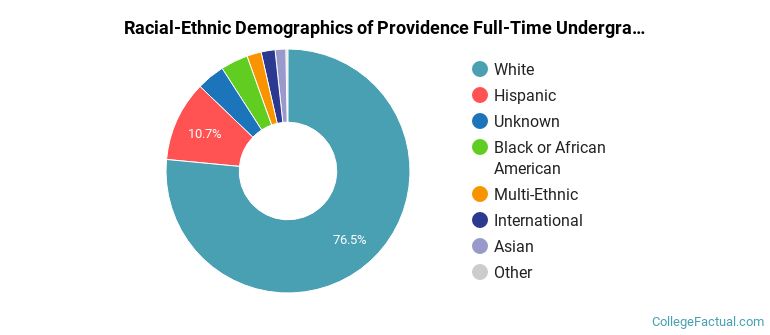
| Race/Ethnicity | Number |
|---|---|
| White | 3,163 |
| Hispanic | 413 |
| Unknown | 143 |
| Black or African American | 140 |
| Multi-Ethnic | 91 |
| Asian | 67 |
| International | 67 |
| Native Hawaiian or Pacific Islander | 11 |
See racial/ethnic breakdown for all students.
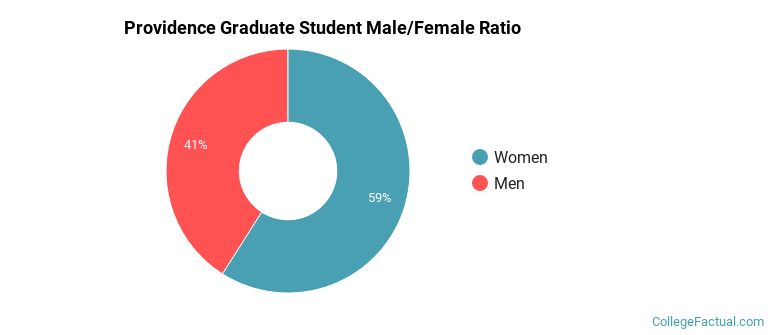
Male/Female Breakdown of Graduate Students
About 57% of full-time grad students are women, and 43% men.
For the gender breakdown for all students, go here.
Providence Racial-Ethnic Breakdown of Graduate Students
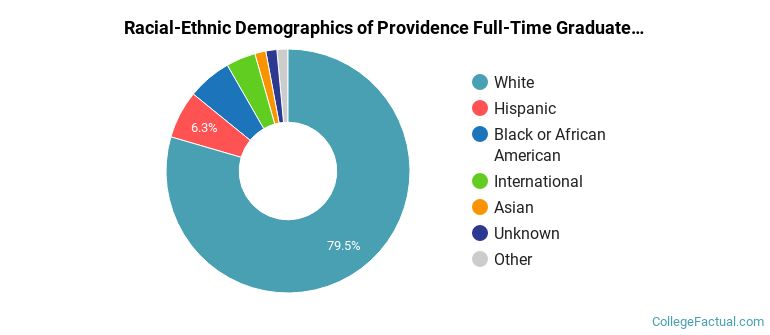
| Race/Ethnicity | Number |
|---|---|
| White | 149 |
| Hispanic | 16 |
| International | 10 |
| Unknown | 10 |
| Black or African American | 7 |
| Asian | 2 |
| Native Hawaiian or Pacific Islander | 1 |
| Multi-Ethnic | 0 |
See racial/ethnic breakdown for all students.
| Race/Ethnicity | Number |
|---|---|
| White | 3,707 |
| Hispanic | 466 |
| Unknown | 189 |
| Black or African American | 176 |
| Multi-Ethnic | 110 |
| International | 79 |
| Asian | 76 |
| Native Hawaiian or Pacific Islander | 13 |
There are approximately 2,666 female students and 2,155 male students at Providence.
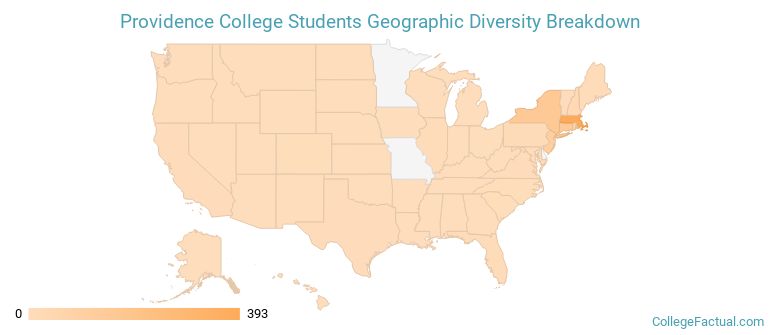
Providence ranks 214 out of 2,183 when it comes to geographic diversity.
91.25% of Providence students come from out of state, and 2.27% come from out of the country.
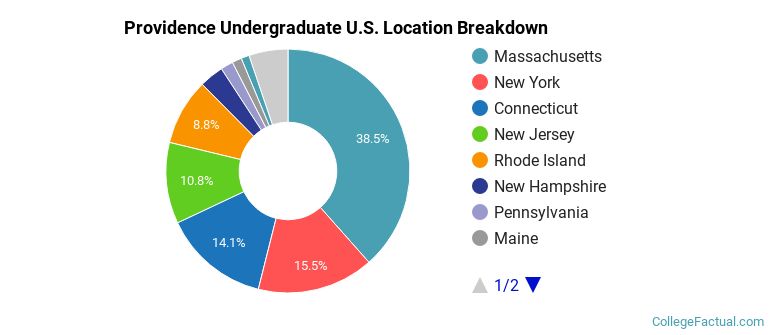
The undergraduate student body is split among 31 states (may include Washington D.C.). Click on the map for more detail.
| State | Amount |
|---|---|
| Massachusetts | 393 |
| New York | 158 |
| Connecticut | 144 |
| New Jersey | 110 |
| Rhode Island | 90 |
Students from 34 countries are represented at this school, with the majority of the international students coming from Canada, Vietnam, and Ireland.
Learn more about international students at Providence.
A traditional college student is defined as being between the ages of 18-21. At Providence, 77.72% of students fall into that category, compared to the national average of 60%.
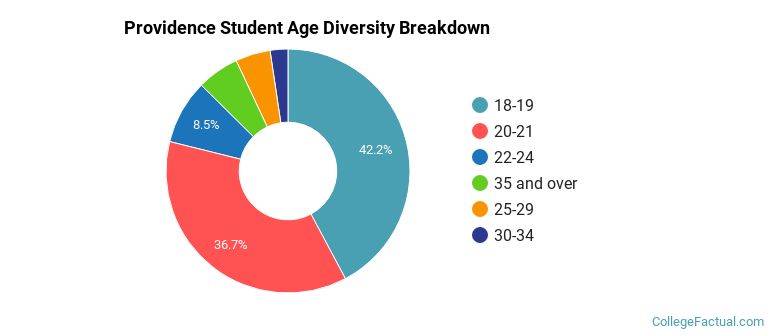
| Student Age Group | Amount |
|---|---|
| 18-19 | 1,932 |
| 20-21 | 1,679 |
| 22-24 | 391 |
| 35 and over | 256 |
| 25-29 | 212 |
| 30-34 | 108 |
| Under 18 | 0 |
Footnotes
*The racial-ethnic minorities count is calculated by taking the total number of students and subtracting white students, international students, and students whose race/ethnicity was unknown. This number is then divided by the total number of students at the school to obtain the racial-ethnic minorities percentage.
References
Department of Homeland Security Citizenship and Immigration Services
Image Credit: By John Phelan under License
Read College Factual's Diversity Ranking Methodology.