Purdue total enrollment is approximately 46,655 students. 33,575 are undergraduates and 6,085 are graduate students.
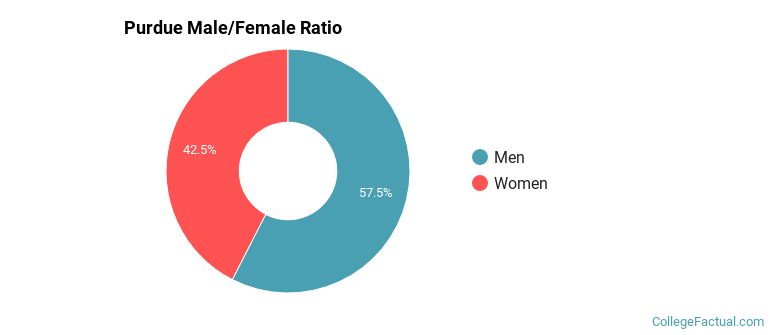
Male/Female Breakdown of Undergraduates
The full-time Purdue undergraduate population is made up of 42% women, and 58% men.
For the gender breakdown for all students, go here.
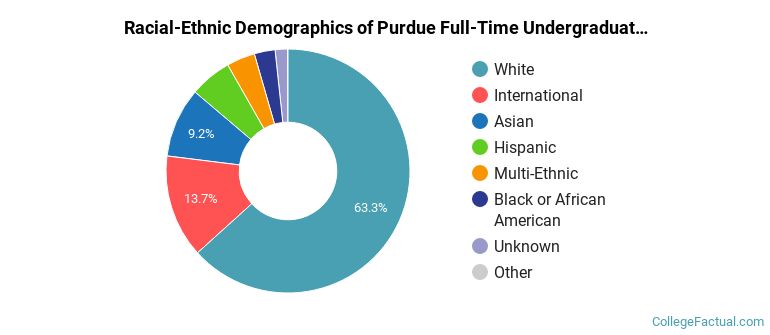
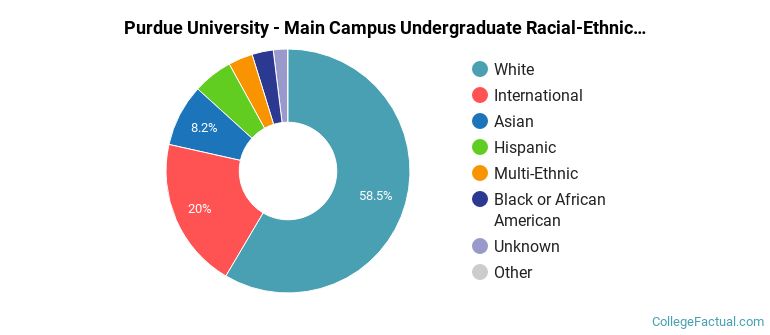
Purdue Racial/Ethnic Breakdown of Undergraduates
| Race/Ethnicity | Number |
|---|---|
| White | 21,255 |
| International | 4,054 |
| Asian | 3,500 |
| Hispanic | 2,011 |
| Multi-Ethnic | 1,429 |
| Black or African American | 865 |
| Unknown | 410 |
| Native Hawaiian or Pacific Islander | 21 |
See racial/ethnic breakdown for all students.
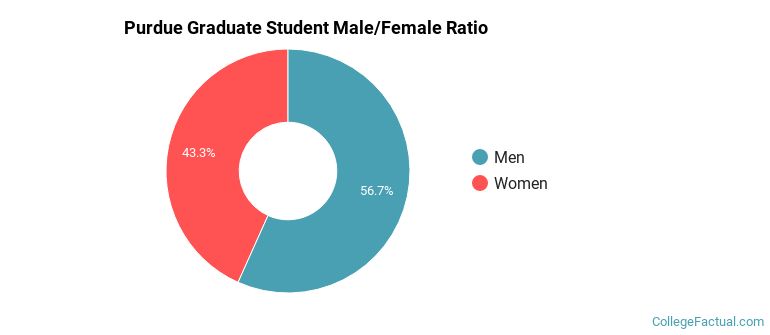
Male/Female Breakdown of Graduate Students
About 43% of full-time grad students are women, and 57% men.
For the gender breakdown for all students, go here.
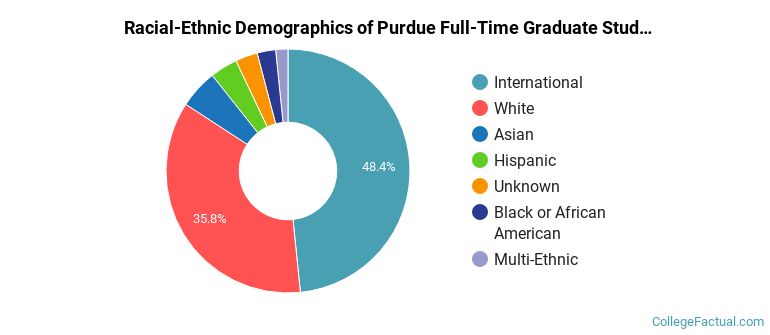
Purdue Racial-Ethnic Breakdown of Graduate Students
| Race/Ethnicity | Number |
|---|---|
| International | 2,573 |
| White | 2,351 |
| Asian | 353 |
| Hispanic | 281 |
| Unknown | 197 |
| Black or African American | 186 |
| Multi-Ethnic | 123 |
| Native Hawaiian or Pacific Islander | 4 |
See racial/ethnic breakdown for all students.
| Race/Ethnicity | Number |
|---|---|
| White | 27,571 |
| International | 8,159 |
| Asian | 4,365 |
| Hispanic | 2,709 |
| Multi-Ethnic | 1,708 |
| Black or African American | 1,300 |
| Unknown | 754 |
| Native Hawaiian or Pacific Islander | 30 |

There are approximately 19,941 female students and 26,714 male students at Purdue.
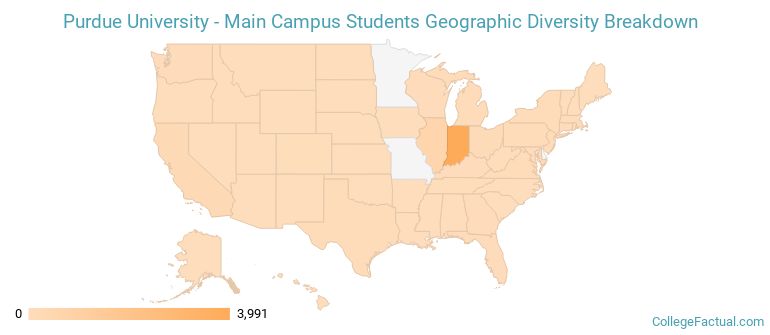
Purdue ranks 244 out of 2,183 when it comes to geographic diversity.
37.37% of Purdue students come from out of state, and 12.64% come from out of the country.
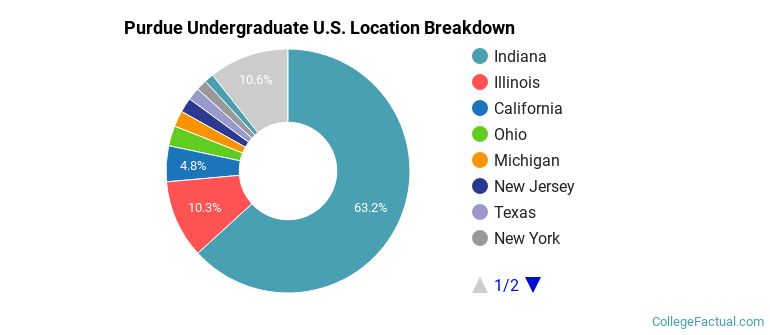
The undergraduate student body is split among 47 states (may include Washington D.C.). Click on the map for more detail.
| State | Amount |
|---|---|
| Indiana | 3,991 |
| Illinois | 653 |
| California | 300 |
| Ohio | 168 |
| Michigan | 134 |
Students from 135 countries are represented at this school, with the majority of the international students coming from China, India, and South Korea.
Learn more about international students at Purdue.
A traditional college student is defined as being between the ages of 18-21. At Purdue, 61.69% of students fall into that category, compared to the national average of 60%.
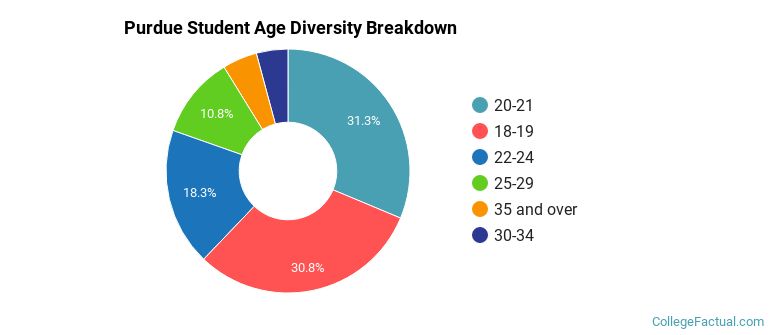
| Student Age Group | Amount |
|---|---|
| 20-21 | 13,270 |
| 18-19 | 13,069 |
| 22-24 | 7,737 |
| 25-29 | 4,586 |
| 35 and over | 1,951 |
| 30-34 | 1,776 |
| Under 18 | 0 |
Footnotes
*The racial-ethnic minorities count is calculated by taking the total number of students and subtracting white students, international students, and students whose race/ethnicity was unknown. This number is then divided by the total number of students at the school to obtain the racial-ethnic minorities percentage.
References
Department of Homeland Security Citizenship and Immigration Services
Image Credit: By Abhijitsathe under License
Learn more about how College Factual creates their Diversity Rankings.