We've pulled together some essential information you should know about the program, including how many students graduate each year, the ethnic diversity of these students, and more. In addition, we cover how QVCC ranks in comparison to other schools with business administration programs.
Go directly to any of the following sections:
The business administration major at QVCC is not ranked on College Factual’s Best Colleges and Universities for Business Administration & Management. This could be for a number of reasons, such as not having enough data on the major or school to make an accurate assessment of its quality.
QVCC does not offer an online option for its business administration bachelor’s degree program at this time. To see if the school offers distance learning options in other areas, visit the QVCC Online Learning page.
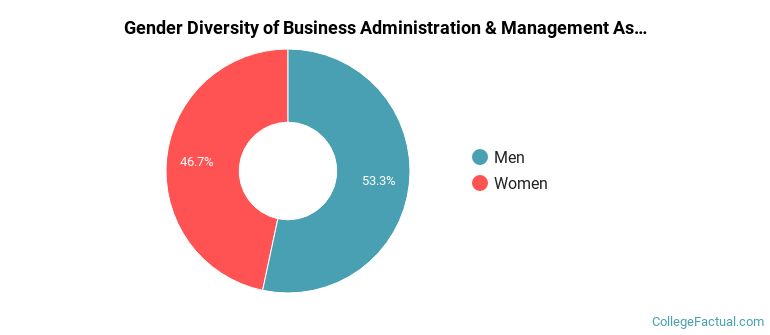
Of the 15 business administration students who graduated with a associate's degree in 2021-2022 from QVCC, about 53% were men and 47% were women.
The majority of the students with this major are white. About 87% of 2022 graduates were in this category.
The following table and chart show the ethnic background for students who recently graduated from Quinebaug Valley Community College with a associate's in business administration.
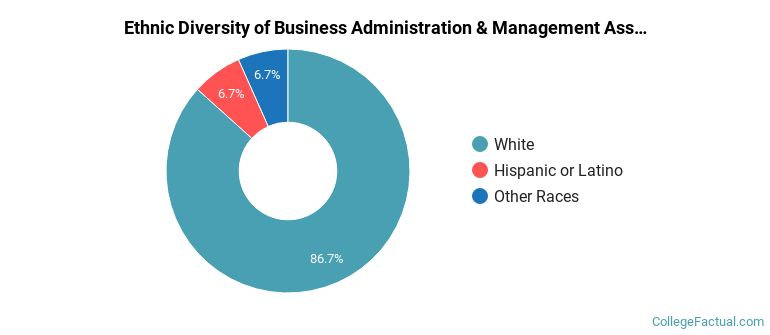
| Ethnic Background | Number of Students |
|---|---|
| Asian | 0 |
| Black or African American | 0 |
| Hispanic or Latino | 1 |
| White | 13 |
| Non-Resident Aliens | 0 |
| Other Races | 1 |
| Related Major | Annual Graduates |
|---|---|
| Business Support & Assistant Services | 6 |
| Accounting | 4 |
View All Business Administration & Management Related Majors >