Quinnipiac total enrollment is approximately 9,746 students. 6,482 are undergraduates and 1,652 are graduate students.
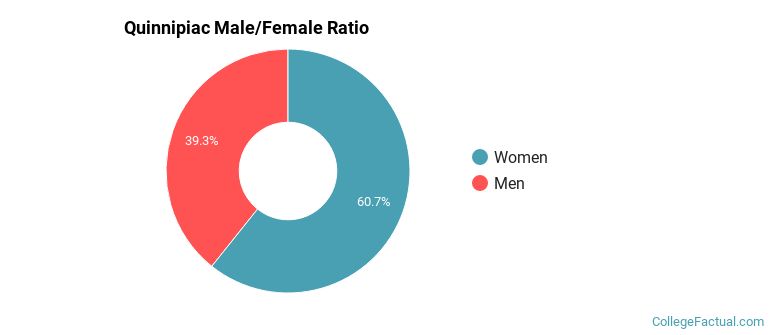
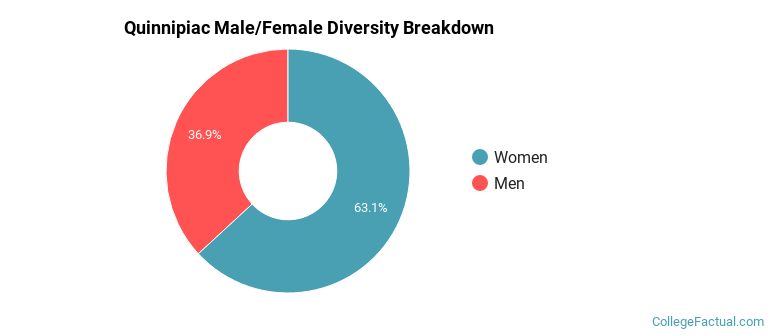
Male/Female Breakdown of Undergraduates
The full-time Quinnipiac undergraduate population is made up of 62% women, and 38% men.
For the gender breakdown for all students, go here.
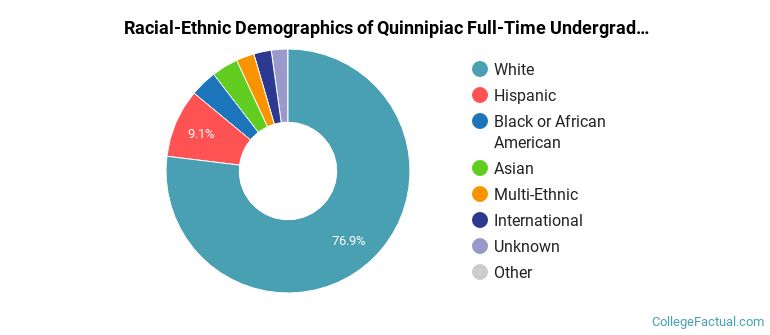
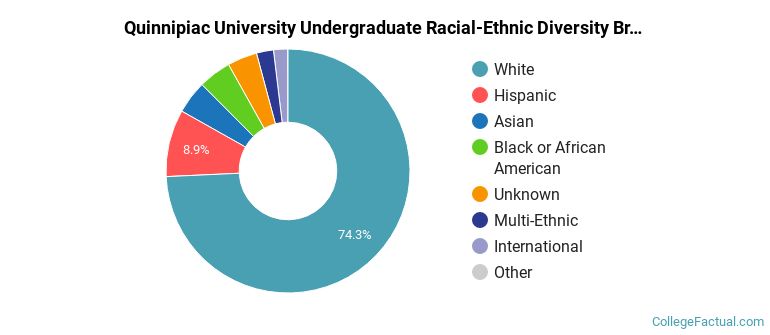
Quinnipiac Racial/Ethnic Breakdown of Undergraduates
| Race/Ethnicity | Number |
|---|---|
| White | 4,922 |
| Hispanic | 634 |
| Black or African American | 232 |
| Asian | 229 |
| Multi-Ethnic | 173 |
| International | 144 |
| Unknown | 137 |
| Native Hawaiian or Pacific Islander | 1 |
See racial/ethnic breakdown for all students.
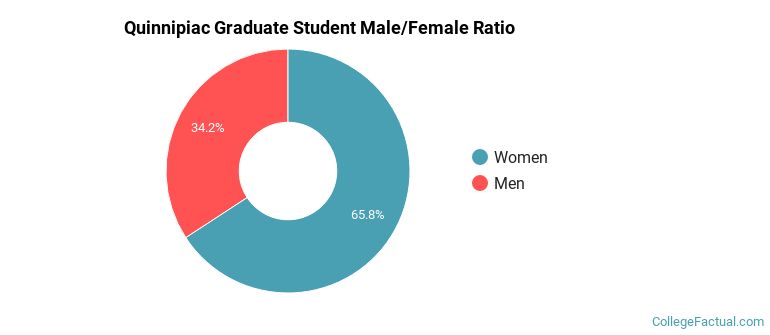
Male/Female Breakdown of Graduate Students
About 65% of full-time grad students are women, and 35% men.
For the gender breakdown for all students, go here.
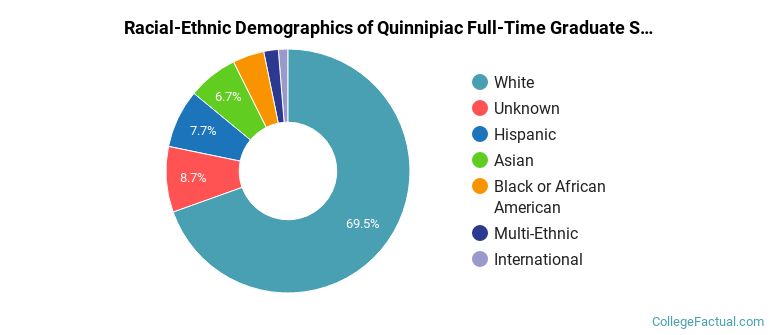
Quinnipiac Racial-Ethnic Breakdown of Graduate Students
| Race/Ethnicity | Number |
|---|---|
| White | 1,199 |
| Hispanic | 136 |
| Asian | 114 |
| Black or African American | 84 |
| Unknown | 70 |
| Multi-Ethnic | 35 |
| International | 12 |
| Native Hawaiian or Pacific Islander | 1 |
See racial/ethnic breakdown for all students.
| Race/Ethnicity | Number |
|---|---|
| White | 7,220 |
| Hispanic | 893 |
| Black or African American | 483 |
| Asian | 398 |
| Unknown | 336 |
| Multi-Ethnic | 236 |
| International | 165 |
| Native Hawaiian or Pacific Islander | 3 |
There are approximately 6,196 female students and 3,550 male students at Quinnipiac.
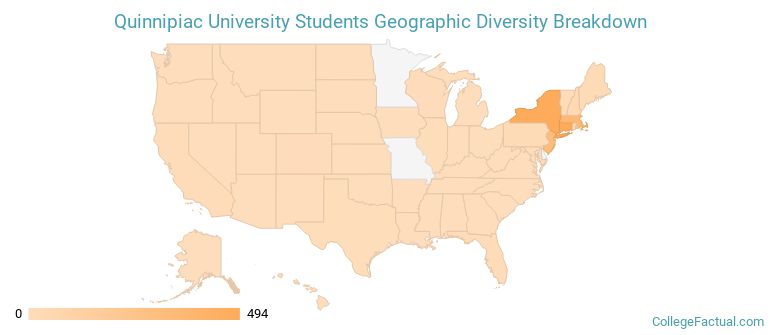
Quinnipiac ranks 355 out of 2,183 when it comes to geographic diversity.
73.75% of Quinnipiac students come from out of state, and 1.47% come from out of the country.
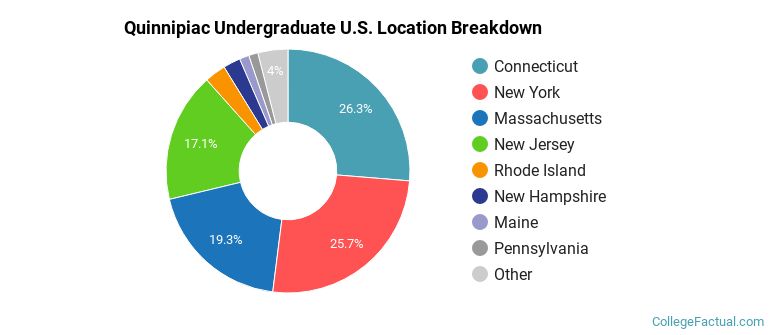
The undergraduate student body is split among 28 states (may include Washington D.C.). Click on the map for more detail.
| State | Amount |
|---|---|
| Connecticut | 494 |
| New York | 483 |
| Massachusetts | 362 |
| New Jersey | 322 |
| Rhode Island | 53 |
Students from 52 countries are represented at this school, with the majority of the international students coming from Saudi Arabia, Canada, and China.
Learn more about international students at Quinnipiac.
A traditional college student is defined as being between the ages of 18-21. At Quinnipiac, 64.34% of students fall into that category, compared to the national average of 60%.
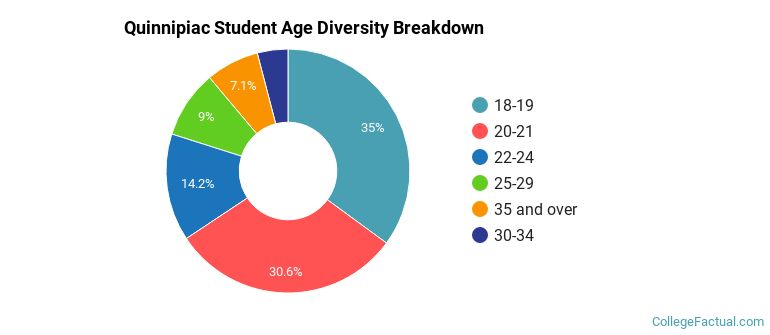
| Student Age Group | Amount |
|---|---|
| 18-19 | 3,503 |
| 20-21 | 3,060 |
| 22-24 | 1,423 |
| 25-29 | 897 |
| 35 and over | 706 |
| 30-34 | 406 |
| Under 18 | 0 |
Footnotes
*The racial-ethnic minorities count is calculated by taking the total number of students and subtracting white students, international students, and students whose race/ethnicity was unknown. This number is then divided by the total number of students at the school to obtain the racial-ethnic minorities percentage.
References
Department of Homeland Security Citizenship and Immigration Services
Image Credit: By JlsElsewhere under License
Find out how College Factual created their Diversity Rankings.