Rasmussen University - Florida total enrollment is approximately 9,055 students. 4,275 are undergraduates and 31 are graduate students.
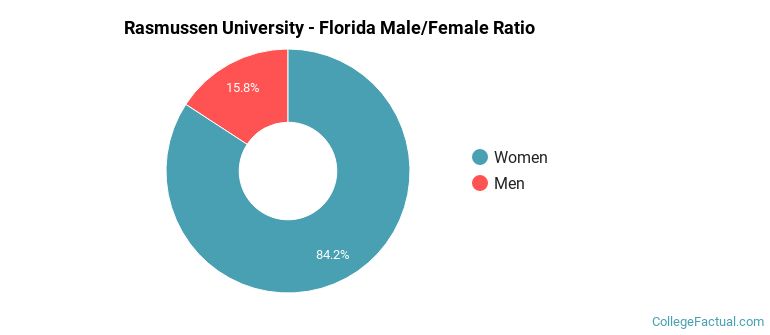
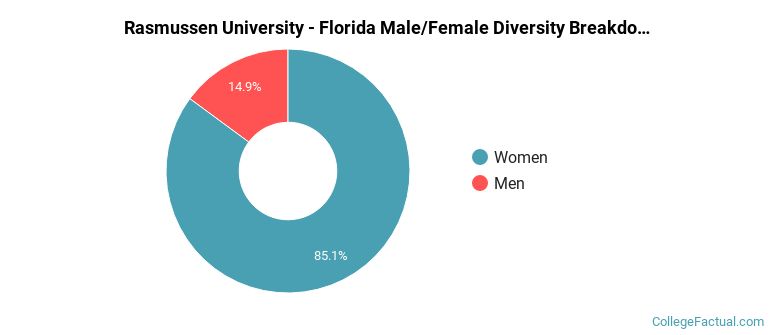
Male/Female Breakdown of Undergraduates
The full-time Rasmussen University - Florida undergraduate population is made up of 86% women, and 14% men.
For the gender breakdown for all students, go here.
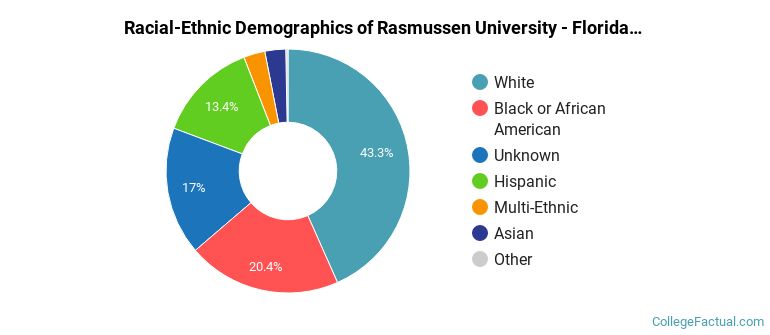
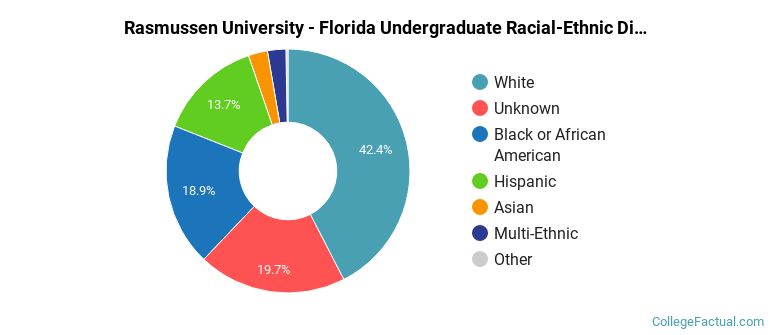
Rasmussen University - Florida Racial/Ethnic Breakdown of Undergraduates
| Race/Ethnicity | Number |
|---|---|
| White | 1,858 |
| Black or African American | 795 |
| Unknown | 687 |
| Hispanic | 656 |
| Multi-Ethnic | 139 |
| Asian | 112 |
| Native Hawaiian or Pacific Islander | 10 |
| International | 0 |
See racial/ethnic breakdown for all students.
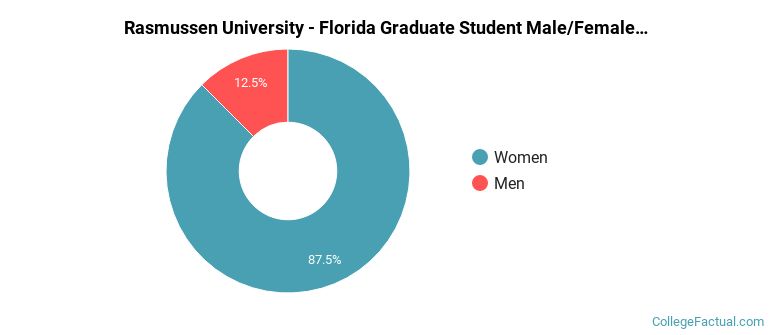
Male/Female Breakdown of Graduate Students
About 87% of full-time grad students are women, and 13% men.
For the gender breakdown for all students, go here.
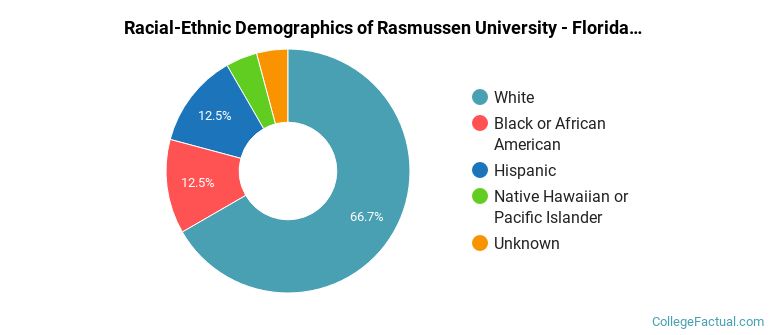
Rasmussen University - Florida Racial-Ethnic Breakdown of Graduate Students
| Race/Ethnicity | Number |
|---|---|
| White | 15 |
| Black or African American | 5 |
| Hispanic | 5 |
| Unknown | 3 |
| Asian | 1 |
| Native Hawaiian or Pacific Islander | 1 |
| Multi-Ethnic | 1 |
| International | 0 |
See racial/ethnic breakdown for all students.
| Race/Ethnicity | Number |
|---|---|
| White | 3,755 |
| Black or African American | 1,731 |
| Unknown | 1,600 |
| Hispanic | 1,438 |
| Multi-Ethnic | 253 |
| Asian | 213 |
| Native Hawaiian or Pacific Islander | 26 |
| International | 0 |
There are approximately 7,833 female students and 1,222 male students at Rasmussen University - Florida.
Rasmussen University - Florida ranks 517 out of 2,183 when it comes to geographic diversity.
33.62% of Rasmussen University - Florida students come from out of state, and 0.28% come from out of the country.
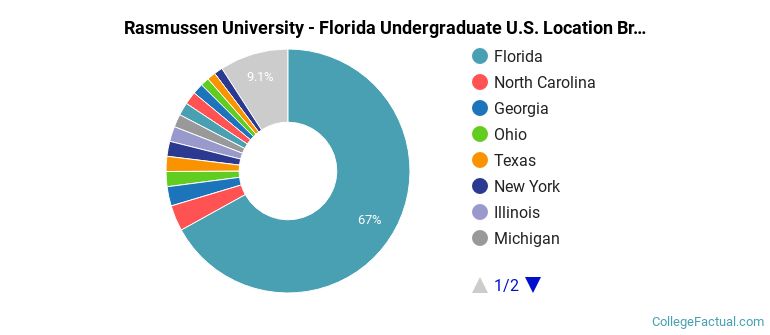
The undergraduate student body is split among 32 states (may include Washington D.C.). Click on the map for more detail.
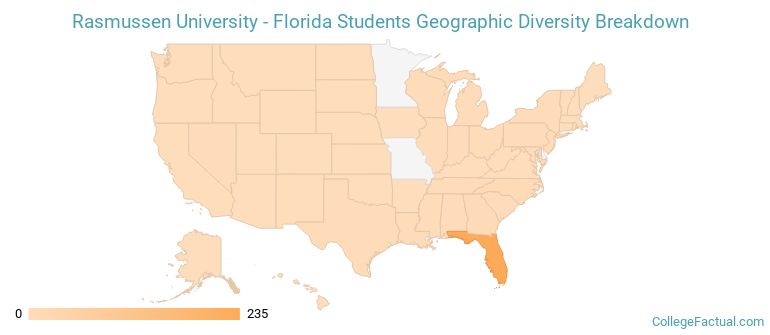
| State | Amount |
|---|---|
| Florida | 235 |
| North Carolina | 12 |
| Georgia | 9 |
| Illinois | 7 |
| New York | 7 |
A traditional college student is defined as being between the ages of 18-21. At Rasmussen University - Florida, 7.30% of students fall into that category, compared to the national average of 60%.
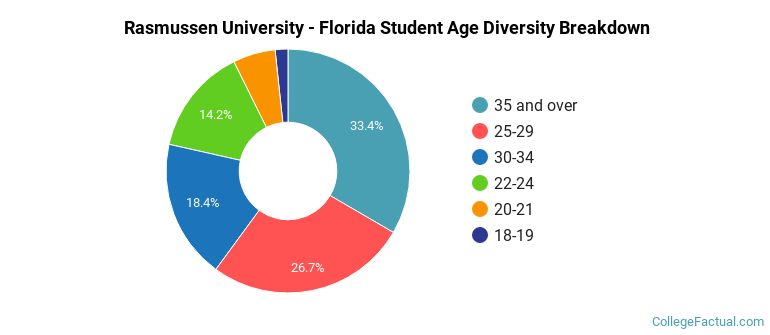
| Student Age Group | Amount |
|---|---|
| 35 and over | 2,714 |
| 25-29 | 2,167 |
| 30-34 | 1,499 |
| 22-24 | 1,151 |
| 20-21 | 457 |
| 18-19 | 138 |
| Under 18 | 0 |
Footnotes
*The racial-ethnic minorities count is calculated by taking the total number of students and subtracting white students, international students, and students whose race/ethnicity was unknown. This number is then divided by the total number of students at the school to obtain the racial-ethnic minorities percentage.
References