
In its yearly rankings, College Factual analyzes over 2,000 colleges and universities to determine which ones are the best in a variety of categories, such as overall value, quality, diversity, which schools are the best for each major, and much more.
Rasmussen University - Illinois was awarded 31 badges in the 2025 rankings. The highest ranked major at the school is nursing.
Explore the best ranked schools for the programs you are most interested in.
College Factual ranked Rasmussen University - Illinois as #111 out of 2,152 colleges and universities in the country on its 2025 Best Colleges list. This puts it in the top 10% of all schools in the nation. This is an improvement over the previous year, when Rasmussen University - Illinois held the #277 spot on the Best Overall Colleges list.
Out of the 85 colleges in Illinois, Rasmussen University - Illinois is ranked at #5.
See all of the rankings for Rasmussen University - Illinois.
Returning adults and other non-traditional students may appreciate the fact that Rasmussen University - Illinois has an open admissions policy. This means that you'll only have to submit basic materials, which may include proof that you completed high school or an equivalent program.
At Rasmussen University - Illinois, the student to faculty ratio is an excellent 11 to 1. That's much better than the national average of 15 to 1. This indicates that many classes will probably be small, and students will have ample opportunites to work closely with their professors and classmates.
When estimating how much access students will have to their teachers, some people like to look at what percentage of faculty members are full time. This is because part-time teachers may not have as much time to spend on campus as their full-time counterparts.
The full-time faculty percentage at Rasmussen University - Illinois is 19%. This is lower than the national average of 47%.
The on-time graduation rate for someone pursuing a bachelor's degree is typically four years. This rate at Rasmussen University - Illinois for first-time, full-time students is 100%, which is better than the national average of 33.3%.
Find out more about the retention and graduation rates at Rasmussen University - Illinois.
During the 2017-2018 academic year, there were 2,407 undergraduates at Rasmussen University - Illinois with 1,049 being full-time and 1,358 being part-time.
| $0-30 K | $30K-48K | $48-75 | $75-110K | $110K + |
|---|---|---|---|---|
| $17,813 | $18,951 | $17,722 | $22,724 | $18,601 |
The net price is calculated by adding tuition, room, board and other costs and subtracting financial aid.Note that the net price is typically less than the published for a school. For more information on the sticker price of Rasmussen University - Illinois, see our tuition and fees and room and board pages.
While almost two-thirds of students nationwide take out loans to pay for college, the percentage may be quite different for the school you plan on attending. At Rasmussen University - Illinois, approximately 95% of students took out student loans averaging $8,285 a year. That adds up to $33,140 over four years for those students.
Get more details about paying for Rasmussen University - Illinois.
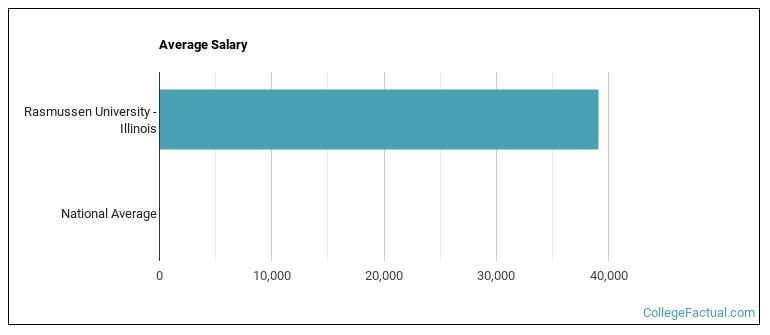
See which majors at Rasmussen University - Illinois make the most money.
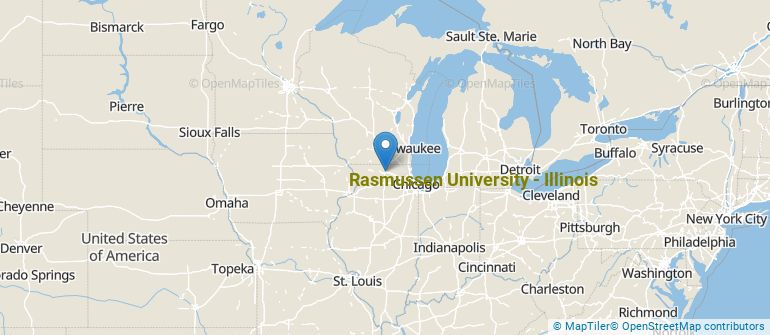
Get more details about the location of Rasmussen University - Illinois.
Contact details for Rasmussen University - Illinois are given below.
| Contact Details | |
|---|---|
| Address: | 6000 East State Street, 4Th Floor, Rockford, IL 61108-2513 |
| Phone: | 815-316-4800 |
| Website: | https://rasmussen.edu/ |
| Most Popular Majors | Bachelor’s Degrees | Average Salary of Graduates |
|---|---|---|
| Nursing | 721 | $74,861 |
| Allied Health & Medical Assisting Services | 154 | NA |
| Health & Medical Administrative Services | 109 | $46,361 |
| Teacher Education Grade Specific | 102 | NA |
| Business Support & Assistant Services | 66 | NA |
| Business Administration & Management | 38 | $59,693 |
| Accounting | 31 | $53,285 |
| Allied Health Professions | 21 | NA |
| Human Resource Management | 20 | $56,465 |
| Criminal Justice & Corrections | 11 | $39,317 |
Online courses area a great option for busy, working students as well as for those who have scheduling conflicts and want to study on their own time. As time goes by, expect to see more and more online learning options become available.
In 2022-2023, 1,748 students took at least one online class at Rasmussen University - Illinois. This is an increase from the 1,708 students who took online classes the previous year.
| Year | Took at Least One Online Class | Took All Classes Online |
|---|---|---|
| 2022-2023 | 1,748 | 1,172 |
| 2021-2022 | 1,708 | 1,211 |
| 2020-2021 | 2,418 | 1,341 |
| 2018-2019 | 1,428 | 914 |
Learn more about online learning at Rasmussen University - Illinois.
Footnotes
*The racial-ethnic minorities count is calculated by taking the total number of students and subtracting white students, international students, and students whose race/ethnicity was unknown. This number is then divided by the total number of students at the school to obtain the racial-ethnic minorities percentage.
References
More about our data sources and methodologies.