Explore the best ranked schools for the programs you are most interested in.
Remington College - Shreveport Campus was not ranked in College Factual's 2025 Best Overall Colleges report. This could be for a number of reasons, including lack of data.
See all of the rankings for Remington College - Shreveport Campus.
Returning adults and other non-traditional students may appreciate the fact that Remington College - Shreveport Campus has an open admissions policy. This means that you'll only have to submit basic materials, which may include proof that you completed high school or an equivalent program.
At Remington College - Shreveport Campus, the student to faculty ratio is 20 to 1. Compared to the national average of 15 to 1, this is somewhat high. This could mean that class sizes may be larger than they are at other colleges or universities or that professors may be required to teach more classes.
Remington College - Shreveport Campus has a freshmen retention rate of 100%. That's a good sign that full-time students like the school and their professors enough to want to stick around for another year. It's also a sign that the admissions team did a good job in choosing applicants who were a good fit for the school.
The on-time graduation rate for someone pursuing a bachelor's degree is typically four years. This rate at Remington College - Shreveport Campus for first-time, full-time students is 73%, which is better than the national average of 33.3%.
Find out more about the retention and graduation rates at Remington College - Shreveport Campus.
During the 2017-2018 academic year, there were 348 full-time undergraduates at Remington College - Shreveport Campus.
The net price is calculated by adding tuition, room, board and other costs and subtracting financial aid.Note that the net price is typically less than the published for a school. For more information on the sticker price of Remington College - Shreveport Campus, see our tuition and fees and room and board pages.
Almost 66% of college students who graduated with the class of 2018 took out student loans, but that percentage varies from school to school. At Remington College - Shreveport Campus, approximately 76% of students took out student loans averaging $7,689 a year. That adds up to $30,756 over four years for those students.
Get more details about paying for Remington College - Shreveport Campus.
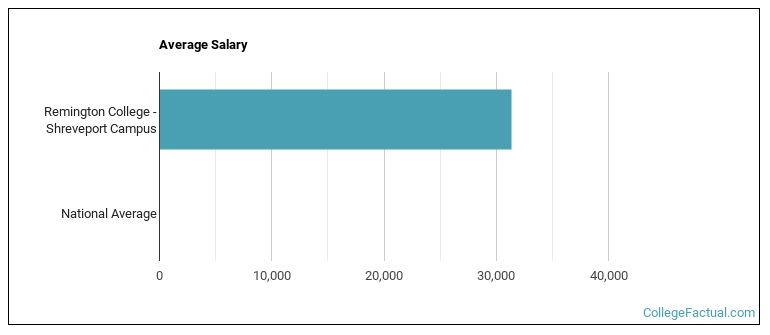
See which majors at Remington College - Shreveport Campus make the most money.
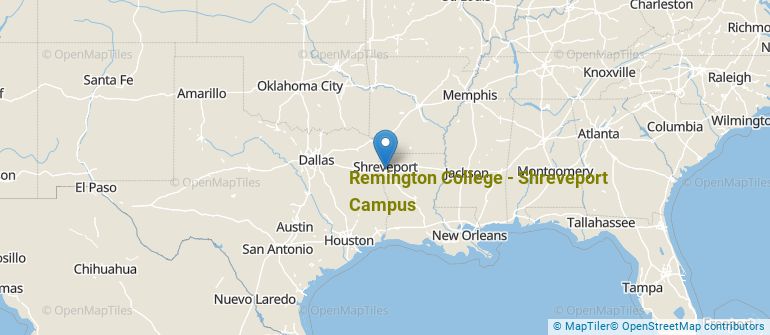
Get more details about the location of Remington College - Shreveport Campus.
Contact details for Remington College - Shreveport Campus are given below.
| Contact Details | |
|---|---|
| Address: | 2106 Bert Kouns Industrial Loop, Shreveport, LA 71118 |
| Phone: | 318-671-4000 |
| Website: | https://www.remingtoncollege.edu/locations/shreveport/ |
| Most Popular Majors | Bachelor’s Degrees | Average Salary of Graduates |
|---|---|---|
| Allied Health & Medical Assisting Services | 131 | NA |
| Health & Medical Administrative Services | 34 | NA |
| Criminal Justice & Corrections | 21 | $31,793 |
| Legal Support Services | 7 | NA |
| Business Administration & Management | 5 | NA |
| Heating, Air Conditioning, Ventilation & Refrigeration | 5 | NA |
| Electronics Engineering Technology | 3 | NA |
| Hospitality Management | 0 | NA |
Online learning options are becoming more and more popular at American colleges and universities. Online classes are great for students who have busy schedules or for those who just want to study on their own time.
In 2022-2023, 352 students took at least one online class at Remington College - Shreveport Campus. This is an increase from the 332 students who took online classes the previous year.
| Year | Took at Least One Online Class | Took All Classes Online |
|---|---|---|
| 2022-2023 | 352 | 0 |
| 2021-2022 | 332 | 0 |
| 2020-2021 | 348 | 0 |
| 2018-2019 | 298 | 0 |
Learn more about online learning at Remington College - Shreveport Campus.
Footnotes
*The racial-ethnic minorities count is calculated by taking the total number of students and subtracting white students, international students, and students whose race/ethnicity was unknown. This number is then divided by the total number of students at the school to obtain the racial-ethnic minorities percentage.
References
More about our data sources and methodologies.