Rice total enrollment is approximately 7,643 students. 3,960 are undergraduates and 3,196 are graduate students.
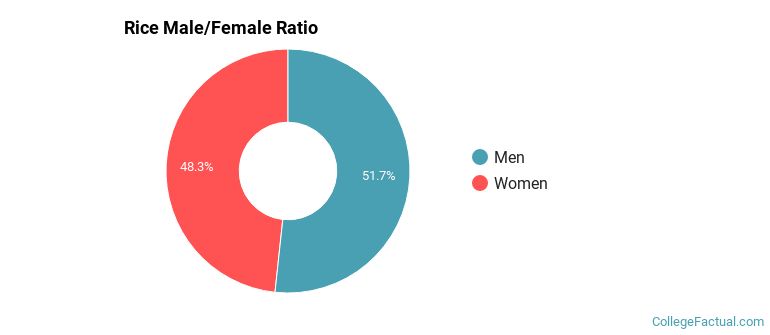
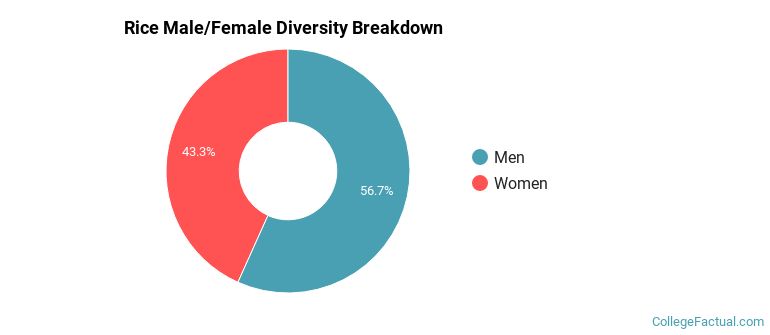
Male/Female Breakdown of Undergraduates
The full-time Rice undergraduate population is made up of 48% women, and 52% men.
For the gender breakdown for all students, go here.
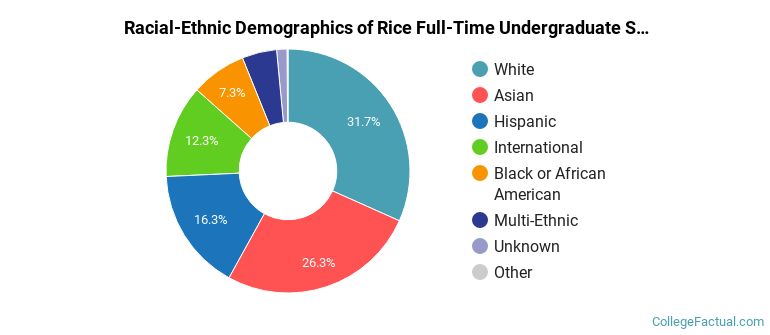
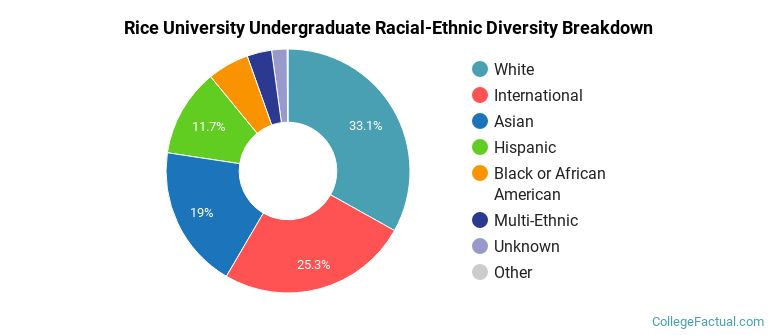
Rice Racial/Ethnic Breakdown of Undergraduates
| Race/Ethnicity | Number |
|---|---|
| White | 1,213 |
| Asian | 1,088 |
| Hispanic | 642 |
| International | 469 |
| Black or African American | 305 |
| Multi-Ethnic | 193 |
| Unknown | 42 |
| Native Hawaiian or Pacific Islander | 5 |
See racial/ethnic breakdown for all students.
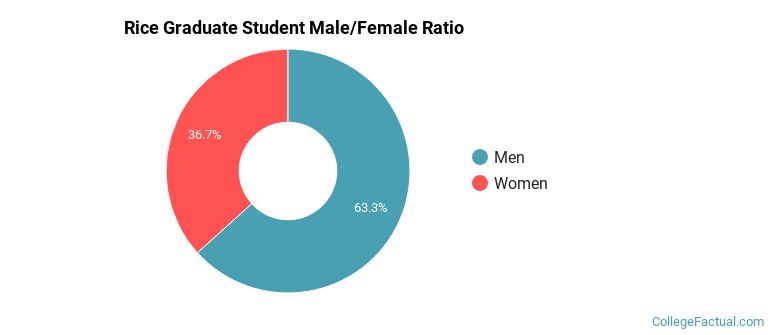
Male/Female Breakdown of Graduate Students
About 36% of full-time grad students are women, and 64% men.
For the gender breakdown for all students, go here.
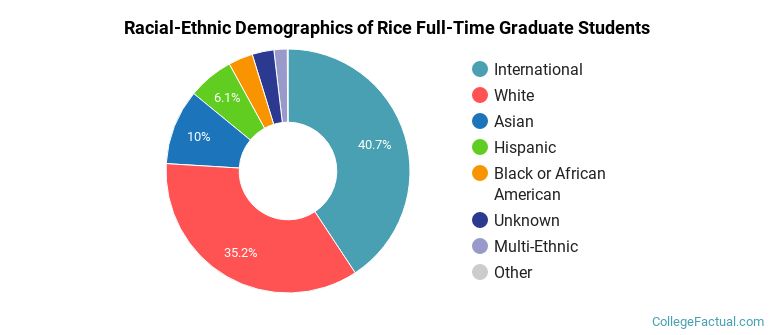
Rice Racial-Ethnic Breakdown of Graduate Students
| Race/Ethnicity | Number |
|---|---|
| White | 1,182 |
| International | 1,131 |
| Asian | 346 |
| Hispanic | 233 |
| Black or African American | 157 |
| Unknown | 77 |
| Multi-Ethnic | 65 |
| Native Hawaiian or Pacific Islander | 2 |
See racial/ethnic breakdown for all students.
| Race/Ethnicity | Number |
|---|---|
| White | 2,553 |
| International | 1,778 |
| Asian | 1,498 |
| Hispanic | 907 |
| Black or African American | 486 |
| Multi-Ethnic | 271 |
| Unknown | 137 |
| Native Hawaiian or Pacific Islander | 7 |
There are approximately 3,229 female students and 4,414 male students at Rice.
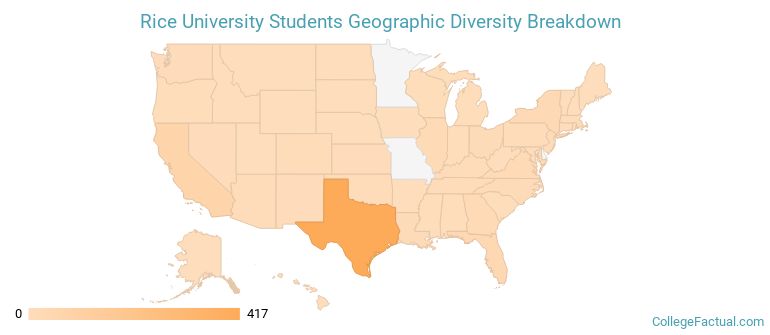
Rice ranks 190 out of 2,183 when it comes to geographic diversity.
51.23% of Rice students come from out of state, and 12.58% come from out of the country.
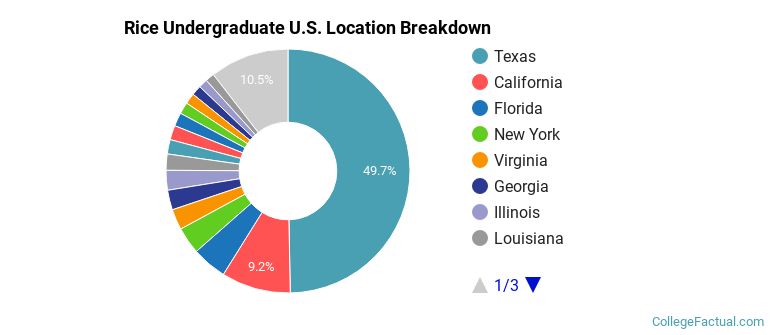
The undergraduate student body is split among 40 states (may include Washington D.C.). Click on the map for more detail.
| State | Amount |
|---|---|
| Texas | 417 |
| California | 77 |
| Florida | 39 |
| New York | 30 |
| Virginia | 23 |
Students from 90 countries are represented at this school, with the majority of the international students coming from China, India, and South Korea.
Learn more about international students at Rice.
A traditional college student is defined as being between the ages of 18-21. At Rice, 47.99% of students fall into that category, compared to the national average of 60%.
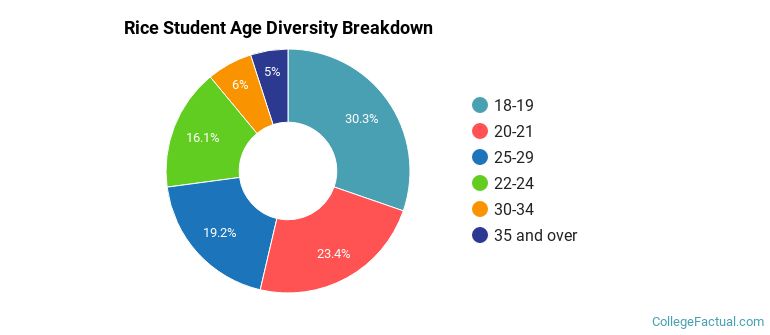
| Student Age Group | Amount |
|---|---|
| 18-19 | 1,903 |
| 20-21 | 1,467 |
| 25-29 | 1,208 |
| 22-24 | 1,012 |
| 30-34 | 379 |
| 35 and over | 312 |
| Under 18 | 0 |
Footnotes
*The racial-ethnic minorities count is calculated by taking the total number of students and subtracting white students, international students, and students whose race/ethnicity was unknown. This number is then divided by the total number of students at the school to obtain the racial-ethnic minorities percentage.
References
Department of Homeland Security Citizenship and Immigration Services
Image Credit: By Anatol Stefanowitsch under License