
College Factual analyzes over 2,000 colleges and universities in its annual rankings and ranks them in a variety of ways, including most diverse, best overall quality, best for non-traditional students, and much more.
Richmond Community College was awarded 15 badges in the 2025 rankings. The highest ranked major at the school is construction trades.
Explore the best ranked schools for the programs you are most interested in.
Richmond Community College landed the #591 spot in College Factual's 2025 ranking of best overall colleges in the United States. The higher ed experts analyzed 2,152 colleges and universities across the nation to determine this ranking. This is an improvement over the previous year, when Richmond Community College held the #1,734 spot on the Best Overall Colleges list.
Richmond Community College is also ranked #19 out of 93 schools in North Carolina.
Since Richmond Community College has an open admissions policy, being accepted to the school isn't that hard. However, a full basic things - such as a high school diploma or equivalent - may be required. Also, go over your application to make sure it is complete before you submit it.
At Richmond Community College, the student to faculty ratio is an excellent 12 to 1. That's much better than the national average of 15 to 1. This indicates that many classes will probably be small, and students will have ample opportunites to work closely with their professors and classmates.
Another measure that is often used to estimate how much access students will have to their professors is how many faculty members are full-time. The idea here is that part-time faculty tend to spend less time on campus, so they may not be as available to students as full-timers.
The full-time faculty percentage at Richmond Community College is 55%. This is higher than the national average of 47%.
The freshmen retention rate tells us what percentage of first-year, full-time students choose to continue on to their sophomore year at a particular school. The rate at Richmond Community College is 67%, which is about average when compared to the national rate of 68%.
During the 2017-2018 academic year, there were 2,226 undergraduates at Richmond Community College with 789 being full-time and 1,437 being part-time.
The net price is calculated by adding tuition, room, board and other costs and subtracting financial aid.Note that the net price is typically less than the published for a school. For more information on the sticker price of Richmond Community College, see our tuition and fees and room and board pages.
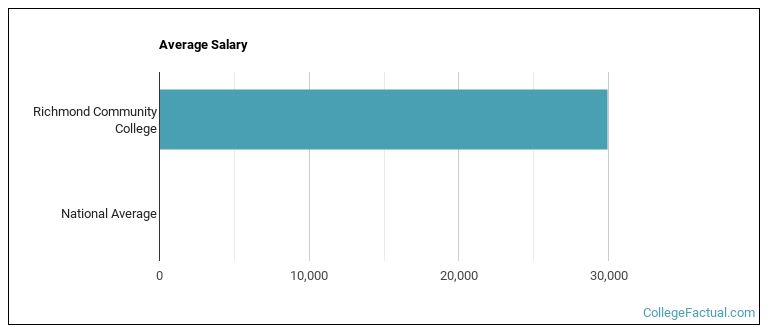
See which majors at Richmond Community College make the most money.
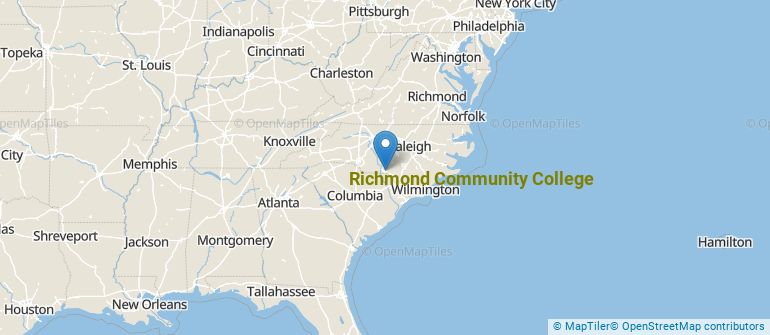
Get more details about the location of Richmond Community College.
Contact details for Richmond Community College are given below.
| Contact Details | |
|---|---|
| Address: | 1042 W Hamlet Ave, Hamlet, NC 28345-1189 |
| Phone: | 910-410-1700 |
| Website: | https://www.richmondcc.edu/ |
| Most Popular Majors | Bachelor’s Degrees | Average Salary of Graduates |
|---|---|---|
| Liberal Arts General Studies | 213 | NA |
| Business Administration & Management | 76 | NA |
| Electrical & Power Transmission Installers | 68 | NA |
| Computer Information Systems | 64 | NA |
| Accounting | 59 | NA |
| Criminal Justice & Corrections | 50 | NA |
| Precision Metal Working | 47 | NA |
| Nursing | 35 | NA |
| Teacher Education Grade Specific | 26 | NA |
| Mental & Social Health Services | 26 | NA |
Online learning is becoming popular at even the oldest colleges and universities in the United States. Not only are online classes great for returning adults with busy schedules, they are also frequented by a growing number of traditional students.
In 2022-2023, 1,227 students took at least one online class at Richmond Community College. This is a decrease from the 1,230 students who took online classes the previous year.
| Year | Took at Least One Online Class | Took All Classes Online |
|---|---|---|
| 2022-2023 | 1,227 | 705 |
| 2021-2022 | 1,230 | 664 |
| 2020-2021 | 1,416 | 777 |
| 2018-2019 | 1,331 | 531 |
Learn more about online learning at Richmond Community College.
Footnotes
*The racial-ethnic minorities count is calculated by taking the total number of students and subtracting white students, international students, and students whose race/ethnicity was unknown. This number is then divided by the total number of students at the school to obtain the racial-ethnic minorities percentage.
References
More about our data sources and methodologies.