Here is an overview of this program at Rider University. Degrees are awarded at the Bachelor’s level, with graduate study also available. It ranks as high as #4 out of 13 schools (Bachelor’s level) by College Factual. Jump to any of the following sections:
College Factual rates Rider University highly for teacher education grade specific, coming in at #110 out of 1,208 schools nationally.
| Ranking | Rank |
|---|---|
| Best Teacher Education Grade Specific Schools | 110 of 1,208 |
| Best Teacher Education Grade Specific Schools in New Jersey | 8 of 22 |
| Best Teacher Education Grade Specific Schools in the Middle Atlantic Region | 30 of 190 |
The following degree levels are granted in teacher education grade specific at Rider University, along with how many graduates complete each level annually.
| Degree Level | Annual Graduates |
|---|---|
| Bachelor’s | 63 |
| Master’s | 37 |
| Graduate Certificate | 19 |
For the most recent IPEDS reporting year, Rider University conferred 63 bachelor’s degrees in teacher education grade specific.
Rider University is in the top 15% of the country for teacher education grade specific at the bachelor’s level. Its best result was #4 out of 13 schools by College Factual.
Teacher Education Grade Specific graduates with a bachelor’s degree from Rider University go on to jobs where they make a median salary of $55,008 a year. This is lower than $62,159, the median for all majors at Rider University.
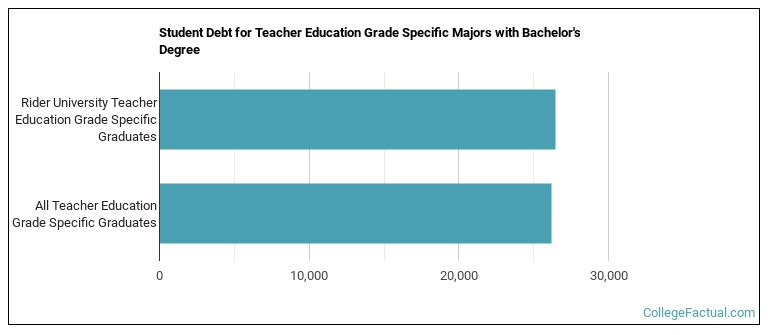
Earning a bachelor’s degree at Rider University, teacher education grade specific students accumulate a median of $26,466 in student loans. This is higher than $26,205, the typical median for all majors at Rider University.
The full-time undergraduate tuition and fees are shown below.
| In State | Out of State | |
|---|---|---|
| Tuition | $35,000 | $39,700 |
| Fees | $1,420 | $1,420 |
Read more about Rider University tuition and fees.
For the most recent academic year available, 19% of teacher education grade specific bachelor’s degrees went to men and 81% went to women.
 The largest share of teacher education grade specific bachelor’s degree graduates at Rider University were White. About 75% of graduates fell into this category.
The following table and chart show the ethnic background for students who recently graduated from Rider University with a bachelor’s in teacher education grade specific.
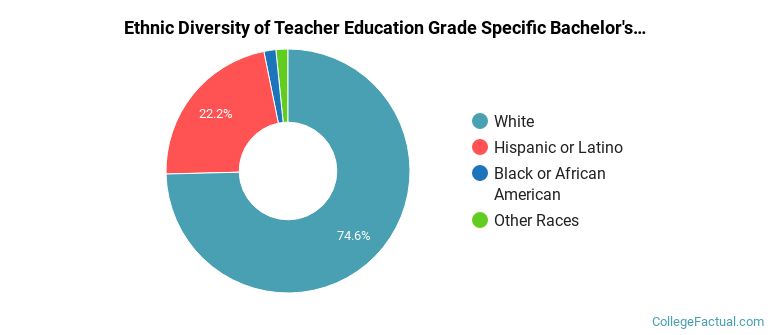
| Ethnic Background | Number of Students |
|---|---|
| Asian | 0 |
| Black or African American | 1 |
| Hispanic or Latino | 14 |
| White | 47 |
| Non-Resident Aliens | 0 |
| Other Races | 1 |
Rider University conferred 48 bachelor’s completions in elementary education and teaching in the latest year of data — 88% to women and 12% to men. The largest share of these graduates were White (75%).
Rider University awarded 15 bachelor’s completions in secondary education and teaching recently — 60% to women and 40% to men. Most of these graduates identified as White (73%).
This program is also offered at the graduate level at Rider University. Here are the graduate award levels offered.
| Graduate Level | Annual Graduates |
|---|---|
| Master’s Degrees in Teacher Education Grade Specific | 37 |
| Graduate Certificate Degrees in Teacher Education Grade Specific | 19 |
