Rider total enrollment is approximately 4,636 students. 3,279 are undergraduates and 296 are graduate students.
Male/Female Breakdown of Undergraduates
The full-time Rider undergraduate population is made up of 58% women, and 42% men.

For the gender breakdown for all students, go here.
Rider Racial/Ethnic Breakdown of Undergraduates

| Race/Ethnicity | Number |
|---|---|
| White | 1,786 |
| Hispanic | 597 |
| Black or African American | 454 |
| Asian | 176 |
| Multi-Ethnic | 116 |
| Unknown | 70 |
| International | 68 |
| Native Hawaiian or Pacific Islander | 3 |
See racial/ethnic breakdown for all students.
Male/Female Breakdown of Graduate Students
About 69% of full-time grad students are women, and 31% men.

For the gender breakdown for all students, go here.
Rider Racial-Ethnic Breakdown of Graduate Students

| Race/Ethnicity | Number |
|---|---|
| White | 179 |
| International | 31 |
| Hispanic | 27 |
| Black or African American | 26 |
| Asian | 16 |
| Unknown | 11 |
| Multi-Ethnic | 6 |
| Native Hawaiian or Pacific Islander | 0 |
See racial/ethnic breakdown for all students.

| Race/Ethnicity | Number |
|---|---|
| White | 2,526 |
| Hispanic | 734 |
| Black or African American | 644 |
| Asian | 242 |
| Unknown | 211 |
| Multi-Ethnic | 147 |
| International | 116 |
| Native Hawaiian or Pacific Islander | 5 |

There are approximately 2,786 female students and 1,850 male students at Rider.
Rider ranks 823 out of 2,183 when it comes to geographic diversity.
25.5% of Rider students come from out of state, and 2.64% come from out of the country.
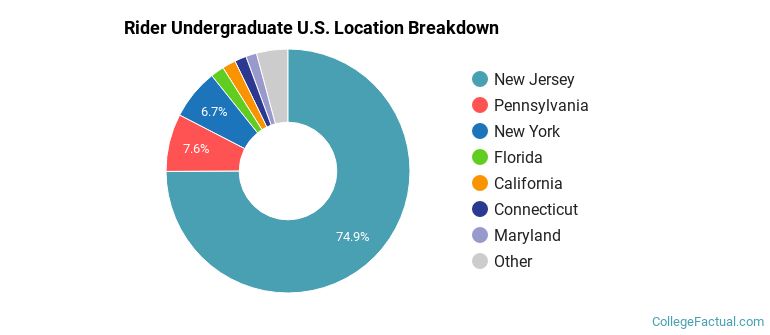
The undergraduate student body is split among 23 states (may include Washington D.C.). Click on the map for more detail.

| State | Amount |
|---|---|
| New Jersey | 628 |
| Pennsylvania | 64 |
| New York | 56 |
| California | 15 |
| Florida | 15 |
Students from 63 countries are represented at this school, with the majority of the international students coming from China, Colombia, and Turkey.
Learn more about international students at Rider.
A traditional college student is defined as being between the ages of 18-21. At Rider, 60.71% of students fall into that category, compared to the national average of 60%.

| Student Age Group | Amount |
|---|---|
| 18-19 | 1,546 |
| 20-21 | 1,534 |
| 22-24 | 1,007 |
| 25-29 | 466 |
| 35 and over | 342 |
| 30-34 | 160 |
| Under 18 | 0 |
Footnotes
*The racial-ethnic minorities count is calculated by taking the total number of students and subtracting white students, international students, and students whose race/ethnicity was unknown. This number is then divided by the total number of students at the school to obtain the racial-ethnic minorities percentage.
References
Department of Homeland Security Citizenship and Immigration Services
Image Credit: By Magneticcarpet under License