College Factual analyzes over 2,000 colleges and universities in its annual rankings and ranks them in a variety of ways, including most diverse, best overall quality, best for non-traditional students, and much more.
Riverside City College was awarded 25 badges in the 2025 rankings. The highest ranked major at the school is health professions.
Explore the best ranked schools for the programs you are most interested in.
According to College Factual's 2025 analysis, Riverside City College is ranked #576 out of 2,152 schools in the nation that were analyzed for overall quality.
Riverside City College is also ranked #71 out of 161 schools in California.
Riverside City College has an open admissions policy, so you should not have much trouble being accepted by the school. Still, it is important to fill out the application completely and submit any requested materials, which may include proof that you have a high school diploma or the equivalent.
At Riverside City College, the student to faculty ratio is 24 to 1. Compared to the national average of 15 to 1, this is somewhat high. This could mean that class sizes may be larger than they are at other colleges or universities or that professors may be required to teach more classes.
Another measure that is often used to estimate how much access students will have to their professors is how many faculty members are full-time. The idea here is that part-time faculty tend to spend less time on campus, so they may not be as available to students as full-timers.
The full-time faculty percentage at Riverside City College is 37%. This is lower than the national average of 47%.
The freshmen retention rate tells us what percentage of first-year, full-time students choose to continue on to their sophomore year at a particular school. The rate at Riverside City College is 69%, which is about average when compared to the national rate of 68%.
During the 2017-2018 academic year, there were 20,080 undergraduates at Riverside City College with 5,922 being full-time and 14,158 being part-time.
| $0-30 K | $30K-48K | $48-75 | $75-110K | $110K + |
|---|---|---|---|---|
| $3,823 | $4,525 | $6,421 | $7,935 | $5,987 |
The net price is calculated by adding tuition, room, board and other costs and subtracting financial aid.Note that the net price is typically less than the published for a school. For more information on the sticker price of Riverside City College, see our tuition and fees and room and board pages.
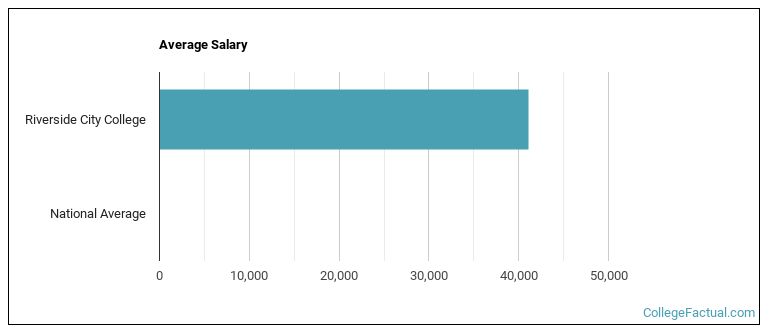
See which majors at Riverside City College make the most money.
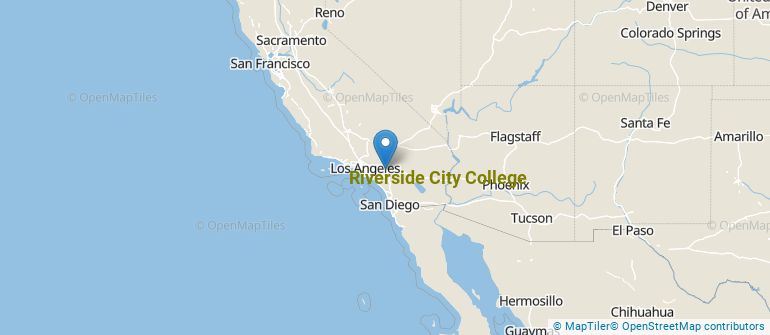
Get more details about the location of Riverside City College.
Contact details for Riverside City College are given below.
| Contact Details | |
|---|---|
| Address: | 4800 Magnolia Avenue, Riverside, CA 92506 |
| Phone: | 951-222-8000 |
| Website: | www.rcc.edu/ |
| Most Popular Majors | Bachelor’s Degrees | Average Salary of Graduates |
|---|---|---|
| Liberal Arts General Studies | 1,872 | NA |
| Biological & Physical Science | 540 | NA |
| Business Administration & Management | 424 | NA |
| Human Development & Family Studies | 223 | NA |
| Practical Nursing & Nursing Assistants | 200 | NA |
| Health & Physical Education | 195 | NA |
| General Psychology | 194 | NA |
| Nursing | 153 | NA |
| Criminal Justice & Corrections | 128 | NA |
| Sociology | 82 | NA |
Online learning is becoming popular at even the oldest colleges and universities in the United States. Not only are online classes great for returning adults with busy schedules, they are also frequented by a growing number of traditional students.
In 2022-2023, 12,717 students took at least one online class at Riverside City College. This is a decrease from the 15,062 students who took online classes the previous year.
| Year | Took at Least One Online Class | Took All Classes Online |
|---|---|---|
| 2022-2023 | 12,717 | 7,555 |
| 2021-2022 | 15,062 | 9,626 |
| 2020-2021 | 7,422 | 2,017 |
| 2018-2019 | 4,991 | 2,045 |
Footnotes
*The racial-ethnic minorities count is calculated by taking the total number of students and subtracting white students, international students, and students whose race/ethnicity was unknown. This number is then divided by the total number of students at the school to obtain the racial-ethnic minorities percentage.
References
More about our data sources and methodologies.