RIT total enrollment is approximately 16,158 students. 12,122 are undergraduates and 2,161 are graduate students.
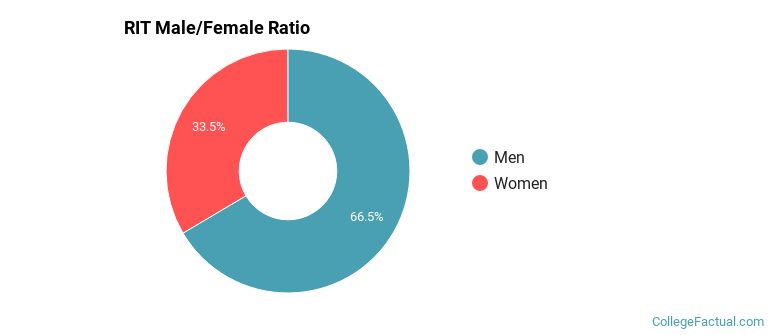
Male/Female Breakdown of Undergraduates
The full-time RIT undergraduate population is made up of 34% women, and 66% men.
For the gender breakdown for all students, go here.
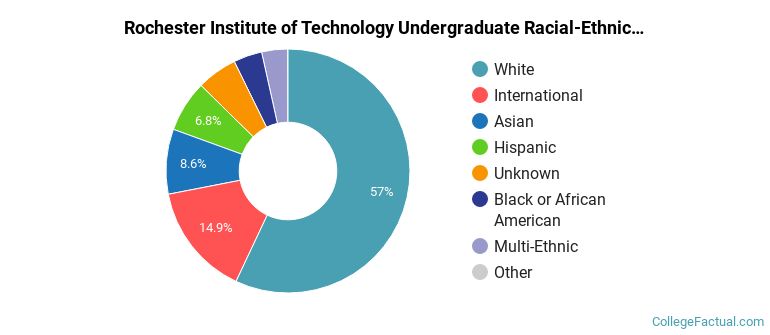
RIT Racial/Ethnic Breakdown of Undergraduates
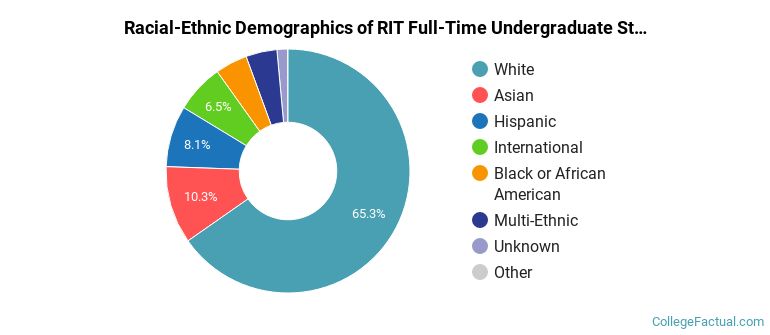
| Race/Ethnicity | Number |
|---|---|
| White | 7,895 |
| Asian | 1,275 |
| Hispanic | 1,068 |
| International | 608 |
| Black or African American | 600 |
| Multi-Ethnic | 539 |
| Unknown | 113 |
| Native Hawaiian or Pacific Islander | 6 |
See racial/ethnic breakdown for all students.
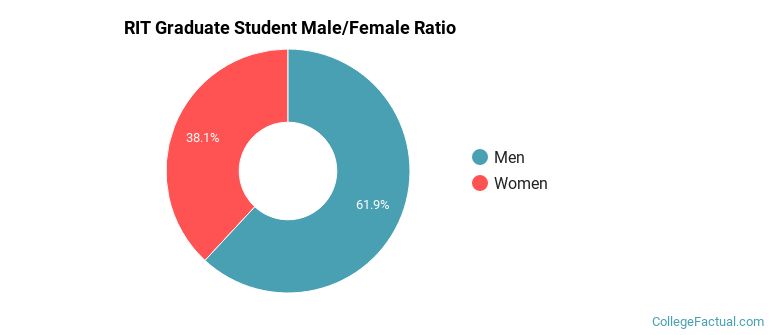
Male/Female Breakdown of Graduate Students
About 39% of full-time grad students are women, and 61% men.
For the gender breakdown for all students, go here.
RIT Racial-Ethnic Breakdown of Graduate Students
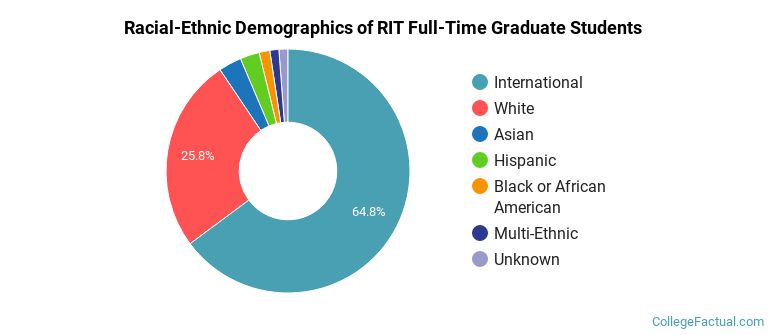
| Race/Ethnicity | Number |
|---|---|
| International | 1,231 |
| White | 664 |
| Asian | 83 |
| Hispanic | 77 |
| Black or African American | 48 |
| Multi-Ethnic | 31 |
| Unknown | 24 |
| Native Hawaiian or Pacific Islander | 1 |
See racial/ethnic breakdown for all students.
| Race/Ethnicity | Number |
|---|---|
| White | 9,177 |
| International | 1,962 |
| Asian | 1,420 |
| Hispanic | 1,211 |
| Unknown | 1,057 |
| Black or African American | 706 |
| Multi-Ethnic | 598 |
| Native Hawaiian or Pacific Islander | 7 |

There are approximately 5,622 female students and 10,536 male students at RIT.
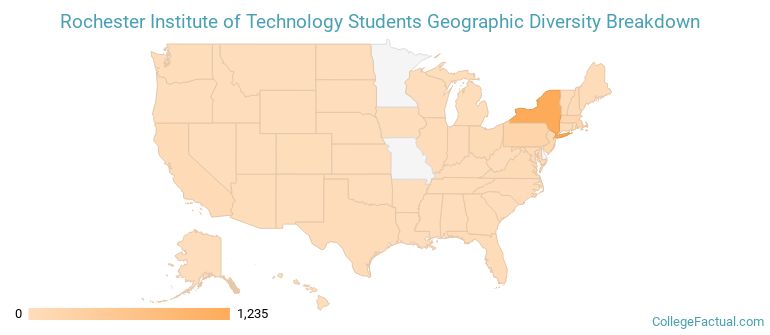
RIT ranks 235 out of 2,183 when it comes to geographic diversity.
49.06% of RIT students come from out of state, and 6.12% come from out of the country.
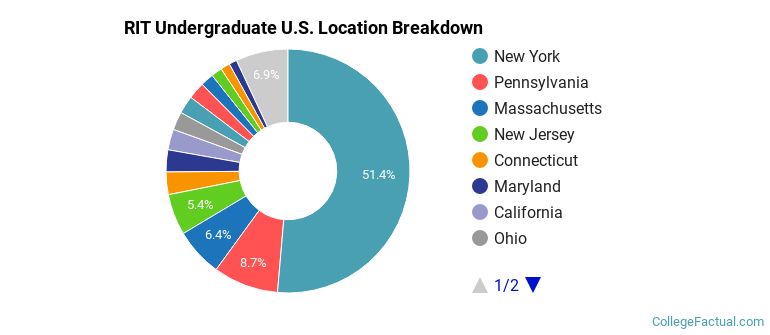
The undergraduate student body is split among 42 states (may include Washington D.C.). Click on the map for more detail.
| State | Amount |
|---|---|
| New York | 1,235 |
| Pennsylvania | 208 |
| Massachusetts | 154 |
| New Jersey | 131 |
| Connecticut | 72 |
Students from 100 countries are represented at this school, with the majority of the international students coming from India, China, and Saudi Arabia.
Learn more about international students at RIT.
A traditional college student is defined as being between the ages of 18-21. At RIT, 59.01% of students fall into that category, compared to the national average of 60%.
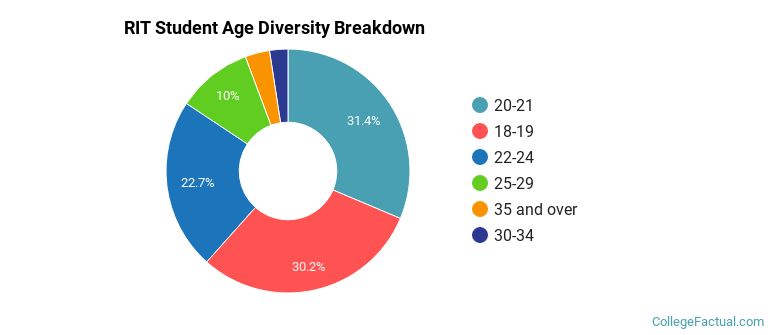
| Student Age Group | Amount |
|---|---|
| 20-21 | 4,982 |
| 18-19 | 4,805 |
| 22-24 | 3,610 |
| 25-29 | 1,586 |
| 35 and over | 517 |
| 30-34 | 387 |
| Under 18 | 0 |
Footnotes
*The racial-ethnic minorities count is calculated by taking the total number of students and subtracting white students, international students, and students whose race/ethnicity was unknown. This number is then divided by the total number of students at the school to obtain the racial-ethnic minorities percentage.
References
Department of Homeland Security Citizenship and Immigration Services
Image Credit: By Matthew D. Wilson (LtPowers) under License
Learn more about how College Factual creates their Diversity Rankings.