We’ve pulled together the essential facts you should know about the program at RSU. It is offered at the Bachelor’s, Associate’s levels. Its best result is a rank of #5 out of 12 schools (Bachelor’s level) by College Factual. Jump to any of the following sections:
By College Factual’s measure, RSU among the top schools in the country for criminal justice & corrections, coming in at #536 out of 1,112 schools nationally.
| Ranking | Rank |
|---|---|
| Best Criminal Justice & Corrections Schools | 536 of 1,112 |
| Best Criminal Justice & Corrections Schools in Oklahoma | 5 of 17 |
| Best Criminal Justice & Corrections Schools in the Southwest Region | 47 of 116 |
The table below lists every degree level offered in criminal justice & corrections at RSU, along with how many graduates complete each level annually.
| Degree Level | Annual Graduates |
|---|---|
| Bachelor’s | 11 |
| Associate’s | 3 |
During the most recent reporting year, Rogers State University awarded 11 bachelor’s degrees in criminal justice & corrections.
RSU is a solid choice among schools offering criminal justice & corrections at the bachelor’s level. Its best result was #5 out of 12 schools by College Factual.
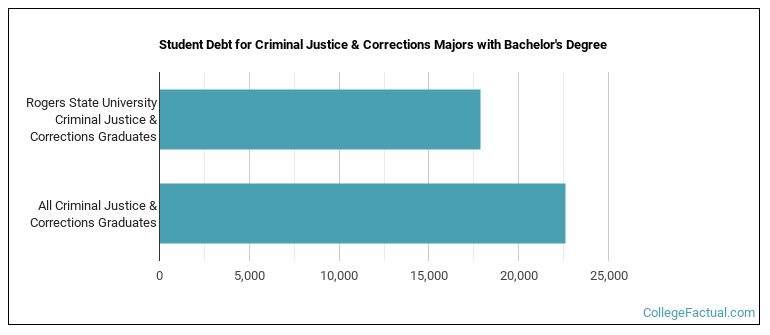
Earning a bachelor’s degree at RSU, criminal justice & corrections graduates take on a median debt of $17,880 in student loans. This is lower than $22,600, the typical median for all majors at RSU.
Average full-time tuition and fees are listed in the table below.
| In State | Out of State | |
|---|---|---|
| Tuition | $4,710 | $13,500 |
| Fees | $2,910 | $2,910 |
Learn more about RSU tuition and fees.
In the most recent graduating class, 36% of criminal justice & corrections bachelor’s degrees went to men and 64% went to women.
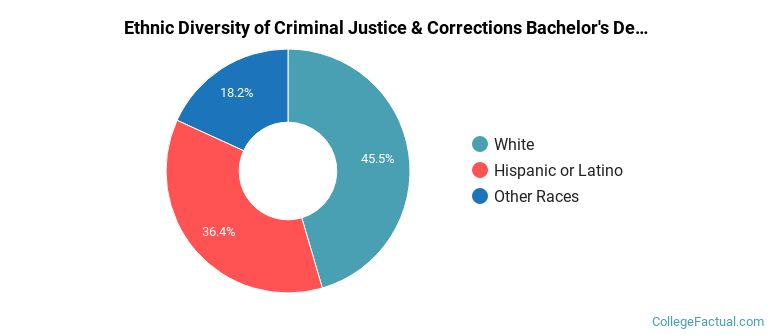
 The largest share of criminal justice & corrections bachelor’s degree graduates at RSU were White. Approximately 45% of graduates fell into this category.
The following table and chart show the ethnic background for students who recently graduated from Rogers State University with a bachelor’s in criminal justice & corrections.
| Ethnic Background | Number of Students |
|---|---|
| Asian | 0 |
| Black or African American | 0 |
| Hispanic or Latino | 4 |
| White | 5 |
| Non-Resident Aliens | 0 |
| Other Races | 2 |
RSU granted 11 bachelor’s degrees in criminal justice/law enforcement administration in the latest year of data — 64% to women and 36% to men. The most common background among these graduates was White (45%).
In the most recent year for which we have data, Rogers State University conferred 3 associate’s degrees in criminal justice & corrections.
RSU is not yet ranked for criminal justice & corrections at the associate’s level.
In the most recent graduating class, 33% of criminal justice & corrections associate’s degrees went to men and 67% went to women.
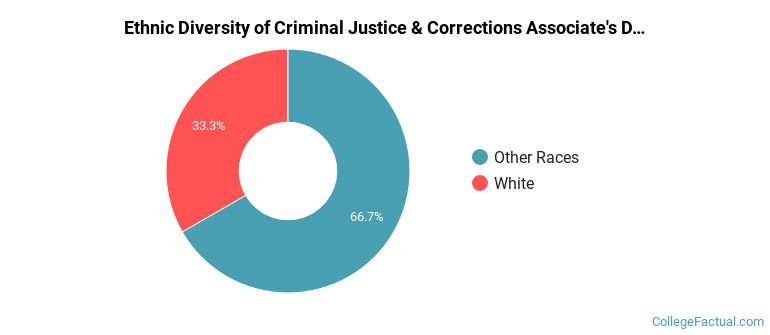
 The largest share of criminal justice & corrections associate’s degree graduates at RSU are White. About 33% of graduates fell into this category.
The following table and chart show the ethnic background for students who recently graduated from Rogers State University with a associate’s in criminal justice & corrections.
| Ethnic Background | Number of Students |
|---|---|
| Asian | 0 |
| Black or African American | 0 |
| Hispanic or Latino | 0 |
| White | 1 |
| Non-Resident Aliens | 0 |
| Other Races | 2 |
RSU awarded 3 associate’s degrees in criminal justice/police science in the most recent reporting year — 67% to women and 33% to men. Most of these graduates identified as White (33%).