Here is an overview of this program at Roosevelt University. Degrees are awarded at the Bachelor’s level, with graduate study also available. At its best it places at #14 out of 14 schools (Bachelor’s level) by College Factual. Jump to any of the following sections:
College Factual rates Roosevelt University as a strong choice for music, coming in at #393 out of 416 schools nationally.
| Ranking | Rank |
|---|---|
| Best Music Schools | 393 of 416 |
| Best Music Schools in Illinois | 14 of 14 |
| Best Music Schools in the Great Lakes Region | 50 of 51 |
Here is each degree level available for music at Roosevelt University, along with how many graduates complete each level annually.
| Degree Level | Annual Graduates |
|---|---|
| Bachelor’s | 16 |
| Master’s | 48 |
| Graduate Certificate | 8 |
During the most recent reporting year, Roosevelt University handed out 16 bachelor’s degrees in music.
Roosevelt University holds a strong position among schools offering music at the bachelor’s level. Its best result was #14 out of 14 schools by College Factual.
| Ranking | Rank |
|---|---|
| Best Music Bachelor’s Degree Schools in Illinois | 14 |
| Best Music Bachelor’s Degree Schools in the Great Lakes Region | 49 |
| Best Music Bachelor’s Degree Schools | 350 |
Music majors who earn their bachelor’s degree from Roosevelt University earn a median of $31,806 a year. This is below $50,780, the median for all majors at Roosevelt University.
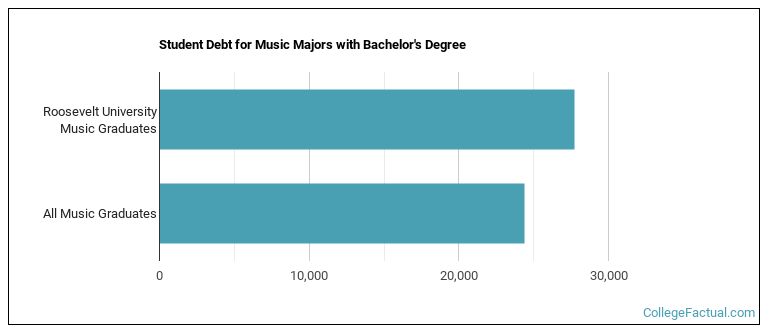
While getting their bachelor’s degree at Roosevelt University, music graduates take on a median debt of $27,750 in student loans. This is higher than $24,370, the typical median for all majors at Roosevelt University.
The full-time undergraduate tuition and fees are shown below.
| In State | Out of State | |
|---|---|---|
| Tuition | $31,493 | $21,000 |
| Fees | $315 | $315 |
Find out more about Roosevelt University tuition and fees.
Among recent graduates, 81% of music bachelor’s degrees went to men and 19% went to women.
 The majority of music bachelor’s degree graduates at Roosevelt University are White. About 56% of graduates fell into this category.
The following table and chart show the ethnic background for students who recently graduated from Roosevelt University with a bachelor’s in music.
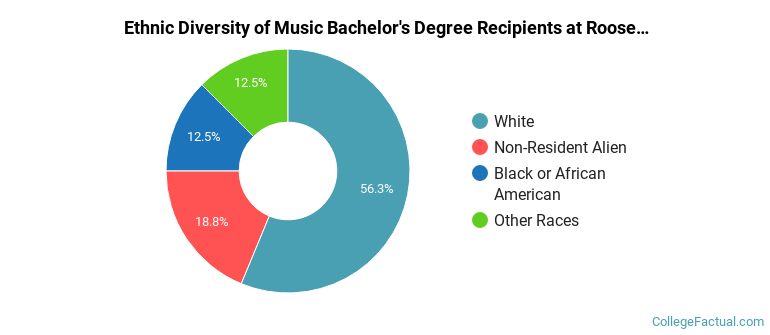
| Ethnic Background | Number of Students |
|---|---|
| Asian | 0 |
| Black or African American | 2 |
| Hispanic or Latino | 0 |
| White | 9 |
| Non-Resident Aliens | 3 |
| Other Races | 2 |
Roosevelt University awarded 8 bachelor’s degrees in stringed instruments in the latest year of data — 25% to women and 75% to men. The most common background among these graduates was White (38%).
Roosevelt University awarded 2 bachelor’s degrees in brass instruments recently — 0% to women and 100% to men. The largest share of these graduates were White (100%).
Roosevelt University conferred 2 bachelor’s degrees in keyboard instruments in the most recent reporting year — 0% to women and 100% to men. The most common background among these graduates was White (50%).
Roosevelt University conferred 1 bachelor’s degree in music theory and composition in the most recent reporting year — 0% to women and 100% to men.
Roosevelt University awarded 1 bachelor’s degree in voice and opera in the most recent reporting year — 0% to women and 100% to men. The largest share of these graduates were White (100%).
Roosevelt University awarded 1 bachelor’s completion in woodwind instruments recently — 0% to women and 100% to men. The most common background among these graduates was White (100%).
Graduate study is also available at Roosevelt University. The following graduate award levels are reported.
| Graduate Level | Annual Graduates |
|---|---|
| Master’s Degrees in Music | 48 |
| Graduate Certificate Degrees in Music | 8 |
