Rowan-Cabarrus Community College total enrollment is approximately 7,109 students.
Male/Female Breakdown of Undergraduates
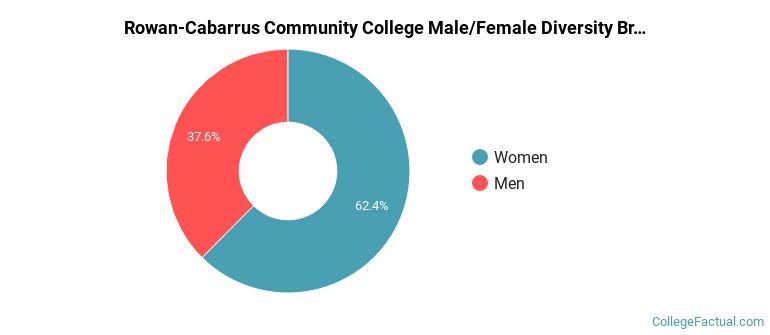
The full-time Rowan-Cabarrus Community College undergraduate population is made up of 61% women, and 39% men.
For the gender breakdown for all students, go here.
Rowan-Cabarrus Community College Racial/Ethnic Breakdown of Undergraduates
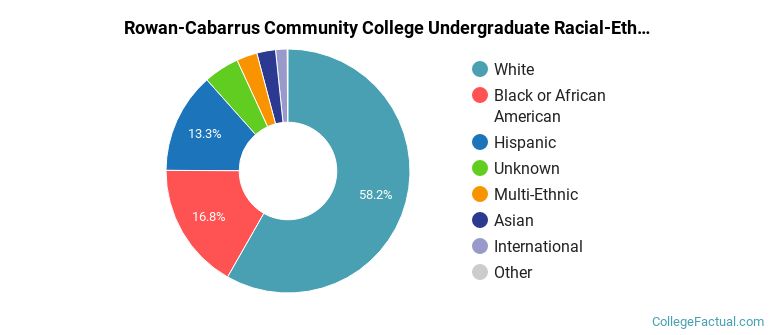
| Race/Ethnicity | Number |
|---|---|
| White | 1,190 |
| Black or African American | 394 |
| Hispanic | 347 |
| Multi-Ethnic | 109 |
| Asian | 33 |
| International | 30 |
| Unknown | 30 |
| Native Hawaiian or Pacific Islander | 2 |
See racial/ethnic breakdown for all students.
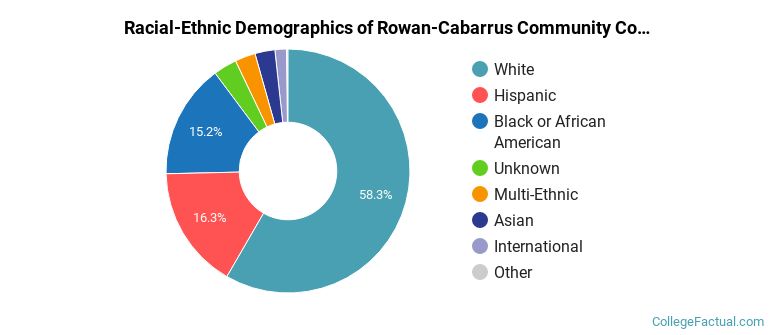
| Race/Ethnicity | Number |
|---|---|
| White | 3,981 |
| Black or African American | 1,281 |
| Hispanic | 923 |
| Multi-Ethnic | 386 |
| Unknown | 229 |
| Asian | 176 |
| International | 104 |
| Native Hawaiian or Pacific Islander | 8 |
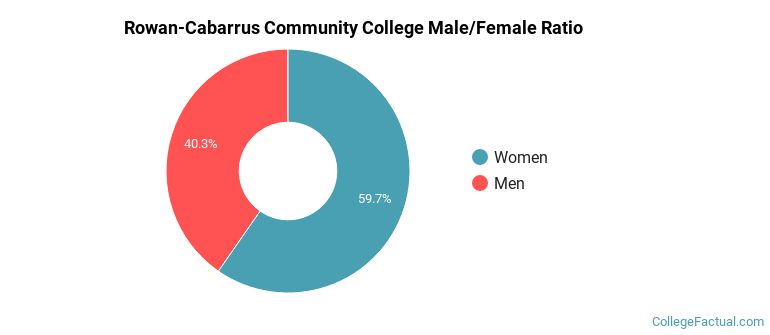
There are approximately 4,627 female students and 2,482 male students at Rowan-Cabarrus Community College.
Students from 2 countries are represented at this school, with the majority of the international students coming from South Korea, and Brazil.
Learn more about international students at Rowan-Cabarrus Community College.
A traditional college student is defined as being between the ages of 18-21. At Rowan-Cabarrus Community College, 38.31% of students fall into that category, compared to the national average of 60%.
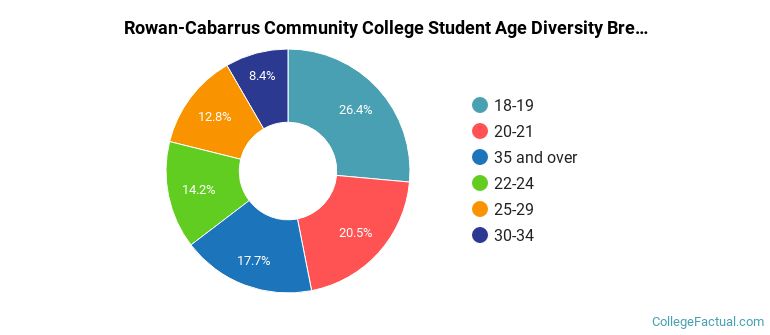
| Student Age Group | Amount |
|---|---|
| 18-19 | 1,257 |
| 20-21 | 972 |
| 35 and over | 843 |
| 22-24 | 677 |
| 25-29 | 607 |
| 30-34 | 397 |
| Under 18 | 0 |
Footnotes
*The racial-ethnic minorities count is calculated by taking the total number of students and subtracting white students, international students, and students whose race/ethnicity was unknown. This number is then divided by the total number of students at the school to obtain the racial-ethnic minorities percentage.
References