We've gathered data and other essential information about the program, such as the average salary of graduates, ethnicity of students, how many students graduated in recent times, and more. We've also included details on how Rutgers New Brunswick ranks compared to other colleges offering a major in accounting.
Jump to any of the following sections:
Rutgers New Brunswick is in the top 10% of the country for accounting. More specifically it was ranked #58 out of 958 schools by College Factual. It is also ranked #2 in New Jersey.
| Ranking Type | Rank |
|---|---|
| Best Accounting Bachelor’s Degree Schools | 55 |
| Best Accounting Schools | 58 |
During the 2021-2022 academic year, Rutgers University - New Brunswick handed out 151 bachelor's degrees in accounting. This is an increase of 3% over the previous year when 146 degrees were handed out.
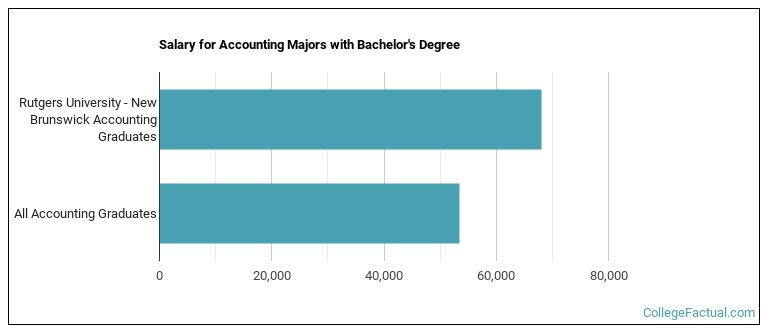
Accounting majors who earn their bachelor's degree from Rutgers New Brunswick go on to jobs where they make a median salary of $68,141 a year. This is great news for graduates of the program, since this figure is higher than the national average of $53,483 for all accounting bachelor's degree recipients.
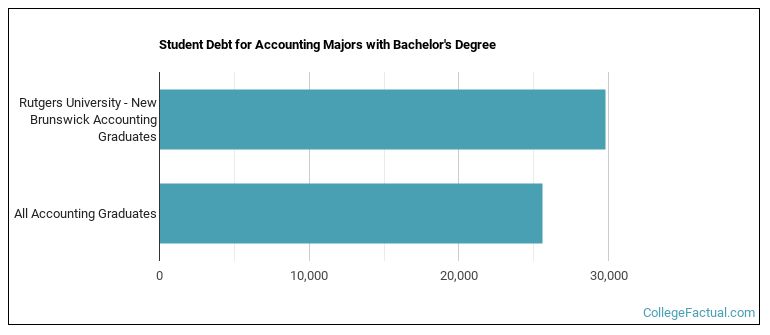
While getting their bachelor's degree at Rutgers New Brunswick, accounting students borrow a median amount of $29,827 in student loans. This is higher than the the typical median of $25,621 for all accounting majors across the country.
The typical student loan payment of a bachelor's degree student from the accounting program at Rutgers New Brunswick is $309 per month.
During the 2022-2023 academic year, part-time undergraduate students at Rutgers New Brunswick paid an average of $1,054 per credit hour if they came to the school from out-of-state. In-state students paid a discounted rate of $441 per credit hour. The average full-time tuition and fees for undergraduates are shown in the table below.
| In State | Out of State | |
|---|---|---|
| Tuition | $13,674 | $32,436 |
| Fees | $3,565 | $3,565 |
| Books and Supplies | $1,391 | $1,391 |
| On Campus Room and Board | $14,715 | $14,715 |
| On Campus Other Expenses | $4,372 | $4,372 |
Learn more about Rutgers New Brunswick tuition and fees.
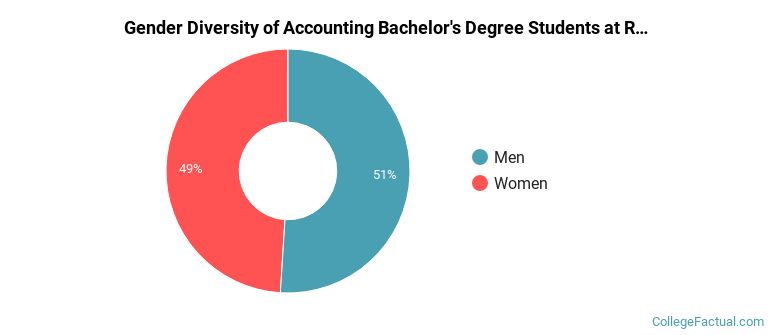
In the 2021-2022 academic year, 151 students earned a bachelor's degree in accounting from Rutgers New Brunswick. About 49% of these graduates were women and the other 51% were men.
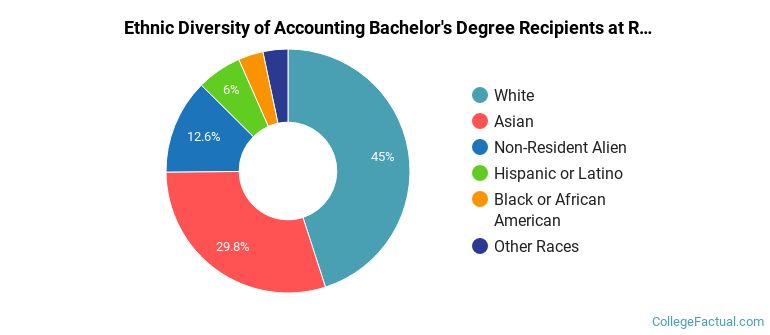
The following table and chart show the ethnic background for students who recently graduated from Rutgers University - New Brunswick with a bachelor's in accounting.
| Ethnic Background | Number of Students |
|---|---|
| Asian | 45 |
| Black or African American | 5 |
| Hispanic or Latino | 9 |
| White | 68 |
| Non-Resident Aliens | 19 |
| Other Races | 5 |
Online degrees for the Rutgers New Brunswick accounting bachelor’s degree program are not available at this time. To see if the school offers distance learning options in other areas, visit the Rutgers New Brunswick Online Learning page.
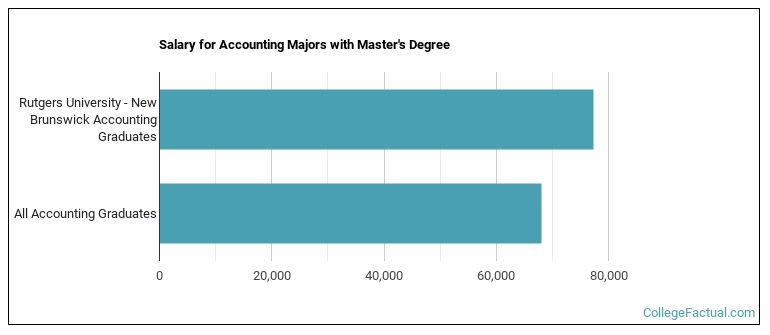
Accounting majors graduating with a master's degree from Rutgers New Brunswick make a median salary of $77,416 a year. This is a better than average outcome since the median salary for all accounting graduates with a master's is $68,141.
Take a look at the following statistics related to the make-up of the accounting majors at Rutgers University - New Brunswick.
| Related Major | Annual Graduates |
|---|---|
| Human Resource Management | 531 |
| Finance & Financial Management | 418 |
| Business Administration & Management | 293 |
| Management Sciences & Quantitative Methods | 253 |
| Marketing | 155 |
More about our data sources and methodologies.