SHSU total enrollment is approximately 21,912 students. 15,020 are undergraduates and 820 are graduate students.
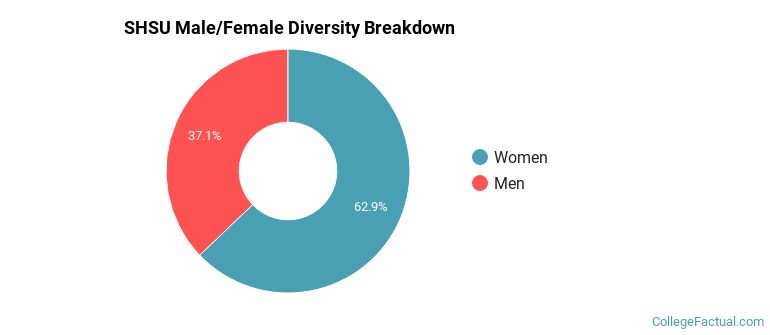
Male/Female Breakdown of Undergraduates
The full-time SHSU undergraduate population is made up of 63% women, and 37% men.

For the gender breakdown for all students, go here.
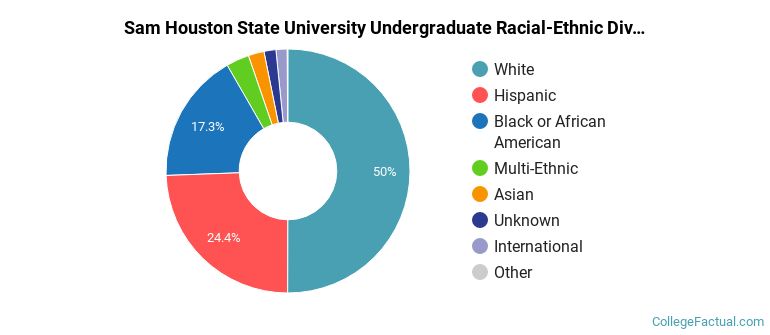
SHSU Racial/Ethnic Breakdown of Undergraduates

| Race/Ethnicity | Number |
|---|---|
| White | 7,139 |
| Hispanic | 3,875 |
| Black or African American | 2,737 |
| Multi-Ethnic | 497 |
| Asian | 312 |
| Unknown | 199 |
| International | 155 |
| Native Hawaiian or Pacific Islander | 21 |
See racial/ethnic breakdown for all students.
Male/Female Breakdown of Graduate Students
About 65% of full-time grad students are women, and 35% men.

For the gender breakdown for all students, go here.
SHSU Racial-Ethnic Breakdown of Graduate Students

| Race/Ethnicity | Number |
|---|---|
| White | 439 |
| Hispanic | 149 |
| Black or African American | 91 |
| Asian | 58 |
| International | 51 |
| Multi-Ethnic | 22 |
| Unknown | 8 |
| Native Hawaiian or Pacific Islander | 0 |
See racial/ethnic breakdown for all students.
| Race/Ethnicity | Number |
|---|---|
| White | 10,736 |
| Hispanic | 5,561 |
| Black or African American | 3,674 |
| Multi-Ethnic | 696 |
| Asian | 516 |
| Unknown | 314 |
| International | 262 |
| Native Hawaiian or Pacific Islander | 23 |
There are approximately 13,972 female students and 7,940 male students at SHSU.
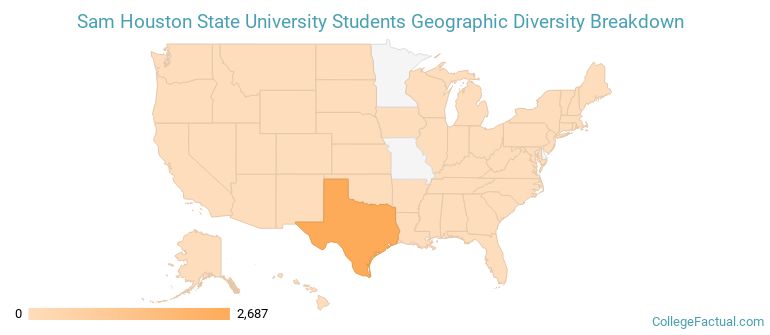
SHSU ranks 1,408 out of 2,183 when it comes to geographic diversity.
1.97% of SHSU students come from out of state, and 0.62% come from out of the country.
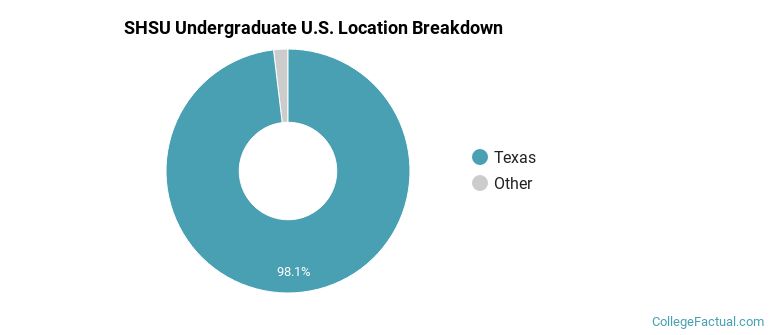
The undergraduate student body is split among 27 states (may include Washington D.C.). Click on the map for more detail.
| State | Amount |
|---|---|
| Texas | 2,687 |
| California | 5 |
| Florida | 5 |
| Oklahoma | 5 |
| Arizona | 3 |
Students from 79 countries are represented at this school, with the majority of the international students coming from China, India, and Turkey.
Learn more about international students at SHSU.
A traditional college student is defined as being between the ages of 18-21. At SHSU, 53.43% of students fall into that category, compared to the national average of 60%.
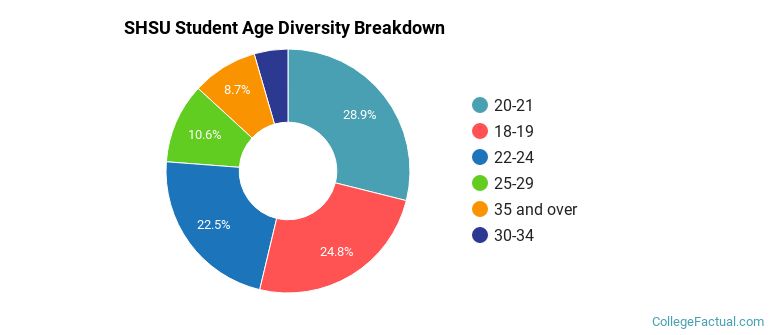
| Student Age Group | Amount |
|---|---|
| 20-21 | 6,018 |
| 18-19 | 5,169 |
| 22-24 | 4,680 |
| 25-29 | 2,212 |
| 35 and over | 1,811 |
| 30-34 | 932 |
| Under 18 | 0 |
Footnotes
*The racial-ethnic minorities count is calculated by taking the total number of students and subtracting white students, international students, and students whose race/ethnicity was unknown. This number is then divided by the total number of students at the school to obtain the racial-ethnic minorities percentage.
References
Department of Homeland Security Citizenship and Immigration Services
Find out how College Factual created their Diversity Rankings.