We've pulled together some essential information you should know about the program, including how many students graduate each year, the ethnic diversity of these students, average starting salaries, and more. Also, learn how SDSU ranks among other schools offering degrees in compsci.
Jump to any of the following sections:
The bachelor's program at SDSU was ranked #96 on College Factual's Best Schools for compsci list. It is also ranked #12 in California.
| Ranking Type | Rank |
|---|---|
| Best Computer Science Graduate Degree Schools | 76 |
| Best Computer Science Master’s Degree Schools | 76 |
| Best Computer Science Bachelor’s Degree Schools | 90 |
| Best Computer Science Schools | 96 |
During the 2021-2022 academic year, San Diego State University handed out 259 bachelor's degrees in computer science. This is a decrease of 12% over the previous year when 295 degrees were handed out.
In 2022, 86 students received their master’s degree in compsci from SDSU. This makes it the #46 most popular school for compsci master’s degree candidates in the country.
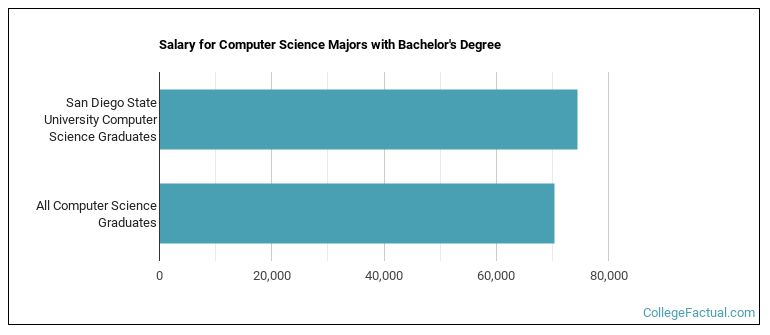
CompSci majors who earn their bachelor's degree from SDSU go on to jobs where they make a median salary of $74,523 a year. This is higher than $70,400, which is the national median for all compsci bachelor's degree recipients.
While getting their bachelor's degree at SDSU, compsci students borrow a median amount of $31,361 in student loans. This is higher than the the typical median of $27,376 for all compsci majors across the country.
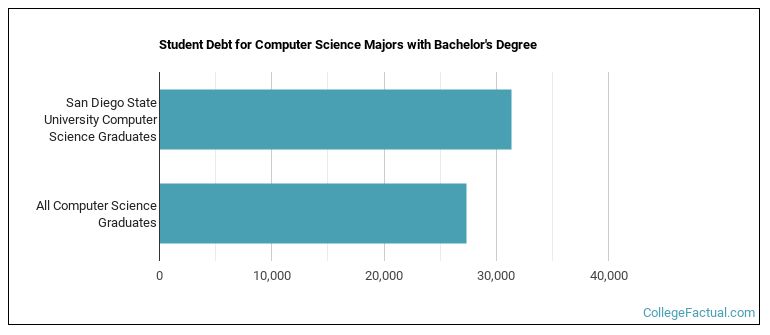
The typical student loan payment of a bachelor's degree student from the compsci program at SDSU is $270 per month.
The following table shows the average full-time tuition and fees for undergraduates.
| In State | Out of State | |
|---|---|---|
| Tuition | $5,742 | $17,622 |
| Fees | $2,548 | $2,548 |
| Books and Supplies | $908 | $908 |
| On Campus Room and Board | $21,630 | $21,630 |
| On Campus Other Expenses | $3,244 | $3,244 |
Learn more about SDSU tuition and fees.
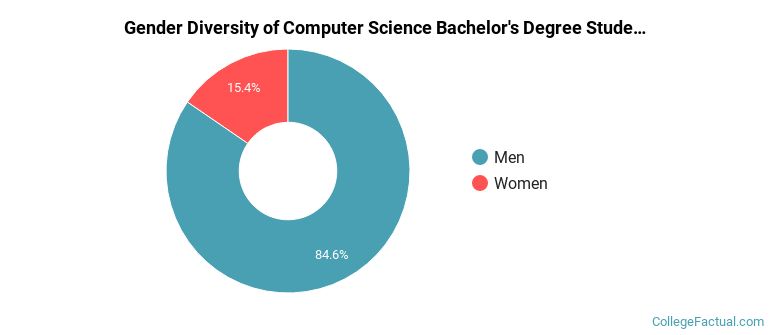
Of the 259 compsci students who graduated with a bachelor's degree in 2021-2022 from SDSU, about 85% were men and 15% were women.
The following table and chart show the ethnic background for students who recently graduated from San Diego State University with a bachelor's in compsci.
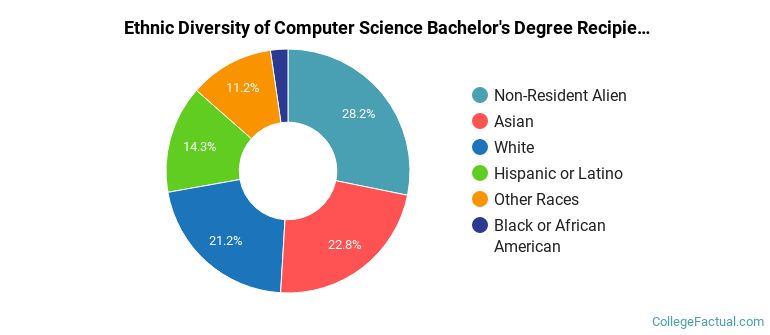
| Ethnic Background | Number of Students |
|---|---|
| Asian | 59 |
| Black or African American | 6 |
| Hispanic or Latino | 37 |
| White | 55 |
| Non-Resident Aliens | 73 |
| Other Races | 29 |
SDSU does not offer an online option for its compsci bachelor’s degree program at this time. To see if the school offers distance learning options in other areas, visit the SDSU Online Learning page.
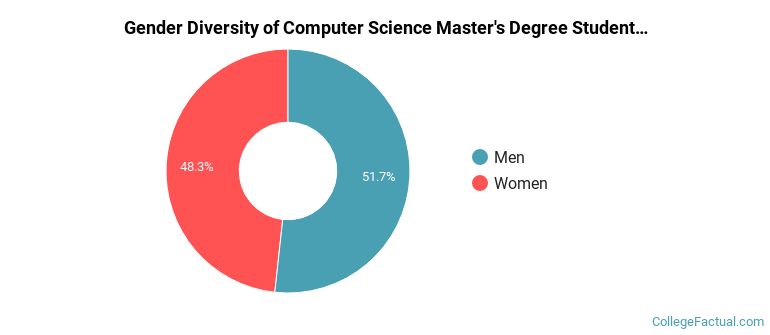
During the 2021-2022 academic year, 29 students graduated with a master's degree in compsci from SDSU. About 52% were men and 48% were women.
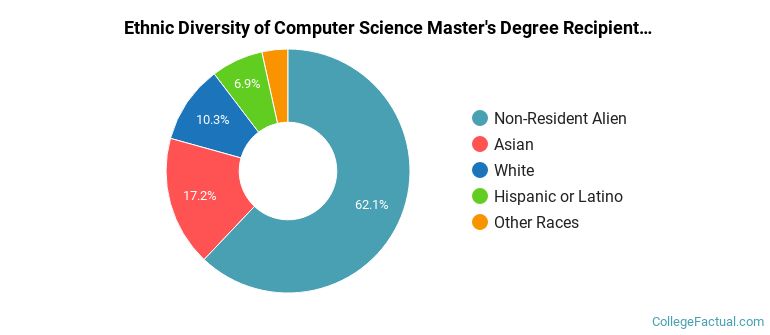
The following table and chart show the ethnic background for students who recently graduated from San Diego State University with a master's in compsci.
| Ethnic Background | Number of Students |
|---|---|
| Asian | 5 |
| Black or African American | 0 |
| Hispanic or Latino | 2 |
| White | 3 |
| Non-Resident Aliens | 18 |
| Other Races | 1 |
Take a look at the following statistics related to the make-up of the compsci majors at San Diego State University.
| Related Major | Annual Graduates |
|---|---|
| Computer Software & Applications | 11 |
| Information Technology | 2 |
More about our data sources and methodologies.