We've gathered data and other essential information about the program, such as the average salary of graduates, ethnicity of students, how many students graduated in recent times, and more. Also, learn how SDSU ranks among other schools offering degrees in ethnic studies.
Jump to any of the following sections:
Learn about start dates, transferring credits, availability of financial aid, and more by contacting the universities below.
Explore societal similarities and differences as seen through cultural, biological, archaeological and linguistic lenses when you earn one of your degrees in anthropology from Southern New Hampshire University.
The bachelor's program at SDSU was ranked #43 on College Factual's Best Schools for ethnic studies list. It is also ranked #10 in California.
| Ranking Type | Rank |
|---|---|
| Best Ethnic Studies Bachelor’s Degree Schools | 43 |
| Best Ethnic Studies Schools | 43 |
During the 2021-2022 academic year, San Diego State University handed out 54 bachelor's degrees in ethnic studies. This is an increase of 38% over the previous year when 39 degrees were handed out.
In 2022, 8 students received their master’s degree in ethnic studies from SDSU. This makes it the #15 most popular school for ethnic studies master’s degree candidates in the country.
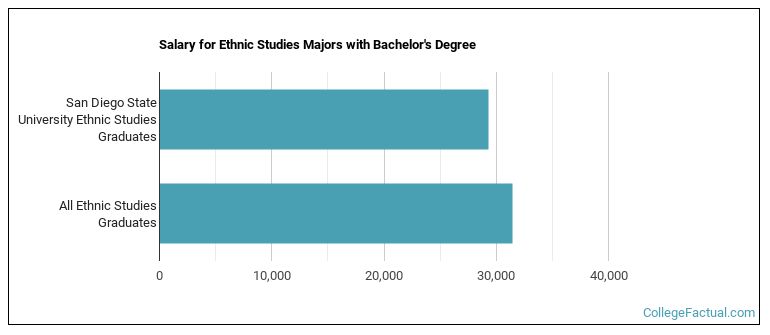
Ethnic Studies majors who earn their bachelor's degree from SDSU go on to jobs where they make a median salary of $29,267 a year. This is less than $31,459, which is the national median of all ethnic studies majors in the nation who earn bachelor's degrees.
The following table shows the average full-time tuition and fees for undergraduates.
| In State | Out of State | |
|---|---|---|
| Tuition | $5,742 | $17,622 |
| Fees | $2,548 | $2,548 |
| Books and Supplies | $908 | $908 |
| On Campus Room and Board | $21,630 | $21,630 |
| On Campus Other Expenses | $3,244 | $3,244 |
Learn more about SDSU tuition and fees.
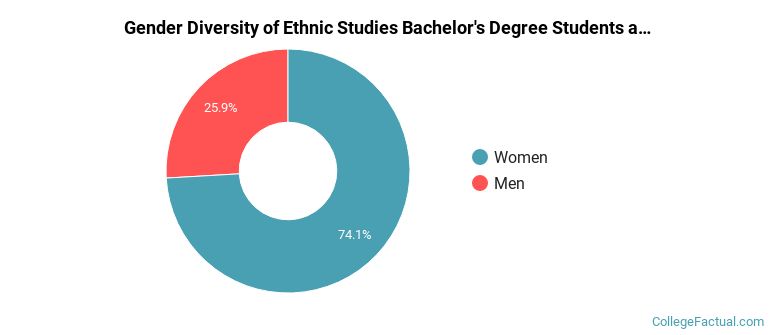
Of the 54 students who earned a bachelor's degree in Ethnic Studies from SDSU in 2021-2022, 26% were men and 74% were women.
The majority of the bachelor's degree graduates for this major are Hispanic or Latino. In the most recent graduating class for which data is available, 52% of grads fell into this category.
The following table and chart show the ethnic background for students who recently graduated from San Diego State University with a bachelor's in ethnic studies.
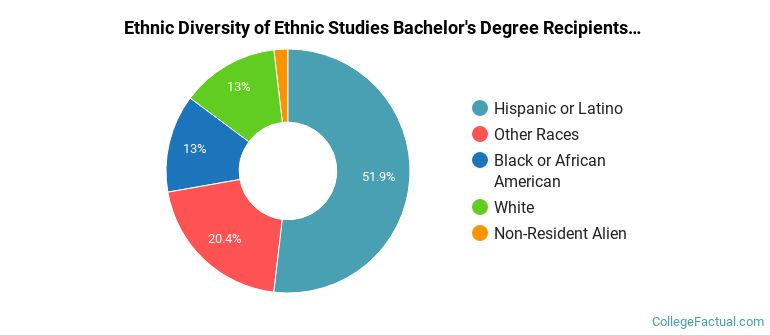
| Ethnic Background | Number of Students |
|---|---|
| Asian | 0 |
| Black or African American | 7 |
| Hispanic or Latino | 28 |
| White | 7 |
| Non-Resident Aliens | 1 |
| Other Races | 11 |
Online degrees for the SDSU ethnic studies bachelor’s degree program are not available at this time. To see if the school offers distance learning options in other areas, visit the SDSU Online Learning page.
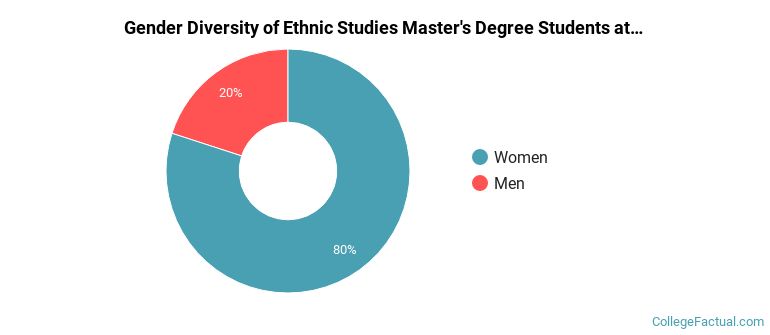
Of the 10 ethnic studies students who graduated with a master's degree in 2021-2022 from SDSU, about 20% were men and 80% were women.
The following table and chart show the ethnic background for students who recently graduated from San Diego State University with a master's in ethnic studies.
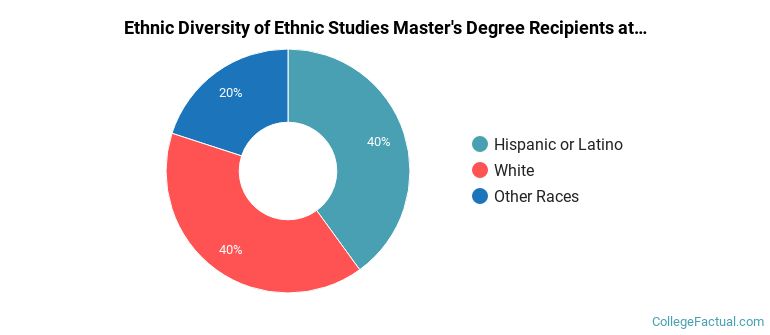
| Ethnic Background | Number of Students |
|---|---|
| Asian | 0 |
| Black or African American | 0 |
| Hispanic or Latino | 4 |
| White | 4 |
| Non-Resident Aliens | 0 |
| Other Races | 2 |
Take a look at the following statistics related to the make-up of the ethnic studies majors at San Diego State University.
| Related Major | Annual Graduates |
|---|---|
| Area Studies | 11 |
| Ethnic, Culture, & Gender Studies (Other) | 2 |
More about our data sources and methodologies.
