SDSU total enrollment is approximately 36,334 students. 28,084 are undergraduates and 3,065 are graduate students.
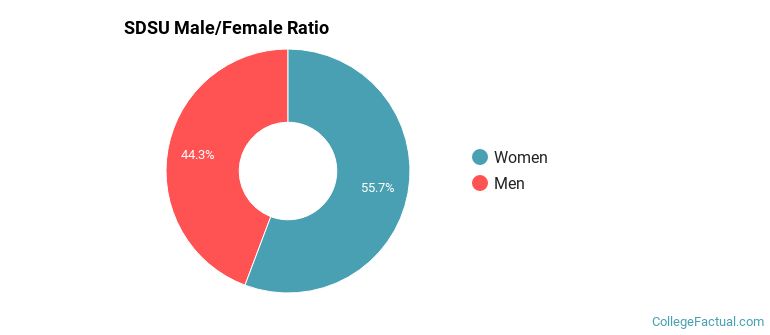
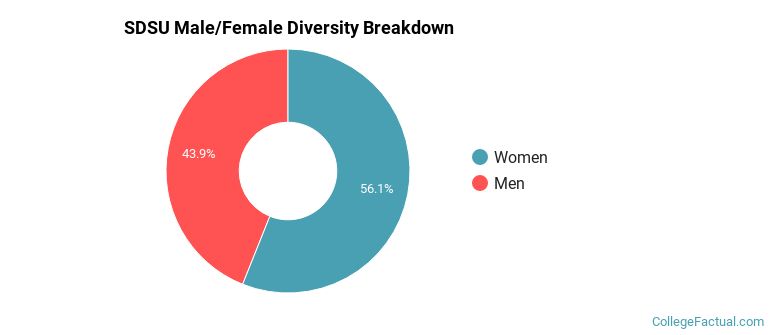
Male/Female Breakdown of Undergraduates
The full-time SDSU undergraduate population is made up of 57% women, and 43% men.
For the gender breakdown for all students, go here.
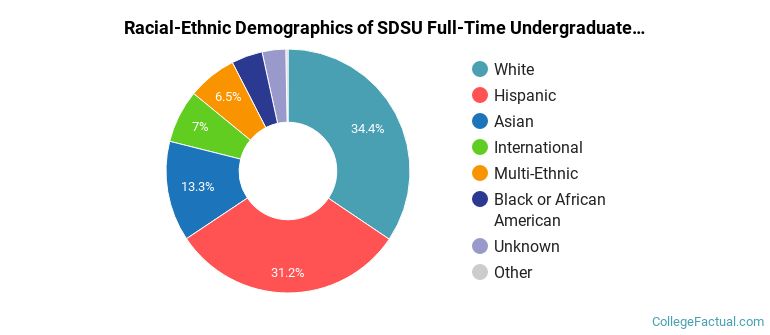
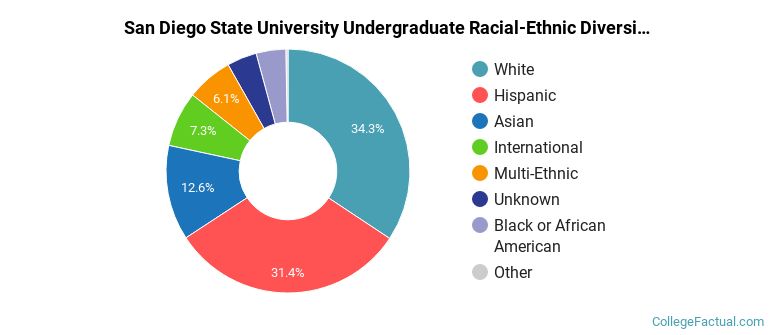
SDSU Racial/Ethnic Breakdown of Undergraduates
| Race/Ethnicity | Number |
|---|---|
| White | 9,551 |
| Hispanic | 9,297 |
| Asian | 3,760 |
| Multi-Ethnic | 1,920 |
| International | 1,371 |
| Black or African American | 1,231 |
| Unknown | 785 |
| Native Hawaiian or Pacific Islander | 70 |
See racial/ethnic breakdown for all students.
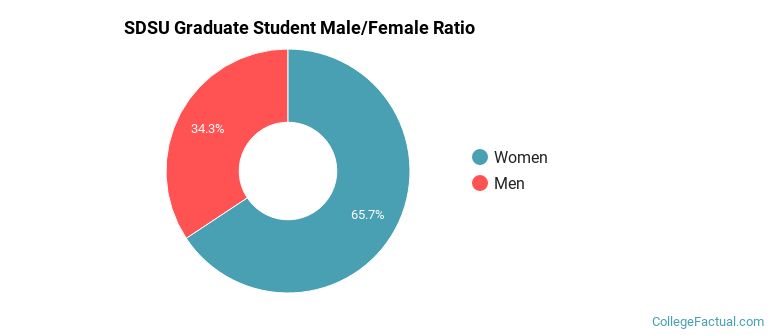
Male/Female Breakdown of Graduate Students
About 67% of full-time grad students are women, and 33% men.
For the gender breakdown for all students, go here.
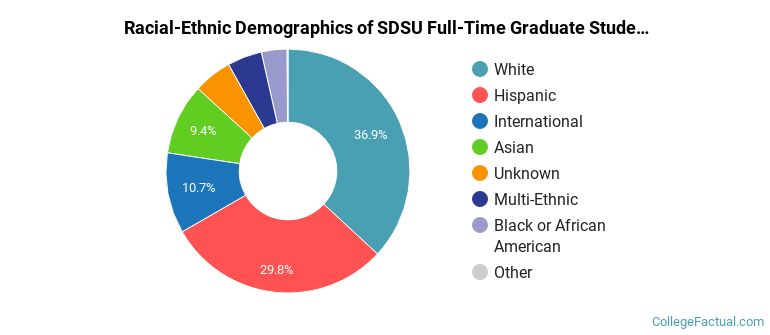
SDSU Racial-Ethnic Breakdown of Graduate Students
| Race/Ethnicity | Number |
|---|---|
| White | 1,115 |
| Hispanic | 997 |
| Asian | 288 |
| International | 241 |
| Multi-Ethnic | 147 |
| Unknown | 138 |
| Black or African American | 122 |
| Native Hawaiian or Pacific Islander | 5 |
See racial/ethnic breakdown for all students.
| Race/Ethnicity | Number |
|---|---|
| White | 12,333 |
| Hispanic | 12,062 |
| Asian | 4,608 |
| Multi-Ethnic | 2,334 |
| International | 1,958 |
| Black or African American | 1,540 |
| Unknown | 1,272 |
| Native Hawaiian or Pacific Islander | 101 |
There are approximately 20,788 female students and 15,546 male students at SDSU.
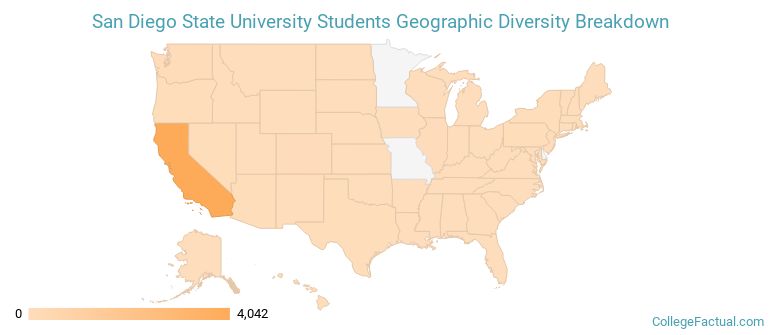
SDSU ranks 477 out of 2,183 when it comes to geographic diversity.
14.71% of SDSU students come from out of state, and 6.64% come from out of the country.
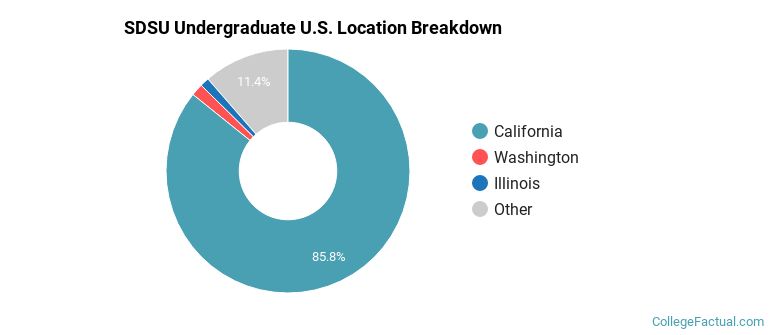
The undergraduate student body is split among 43 states (may include Washington D.C.). Click on the map for more detail.
| State | Amount |
|---|---|
| California | 4,042 |
| Washington | 76 |
| Illinois | 57 |
| Colorado | 47 |
| New Jersey | 42 |
Students from 98 countries are represented at this school, with the majority of the international students coming from China, India, and Kuwait.
Learn more about international students at SDSU.
A traditional college student is defined as being between the ages of 18-21. At SDSU, 55.06% of students fall into that category, compared to the national average of 60%.
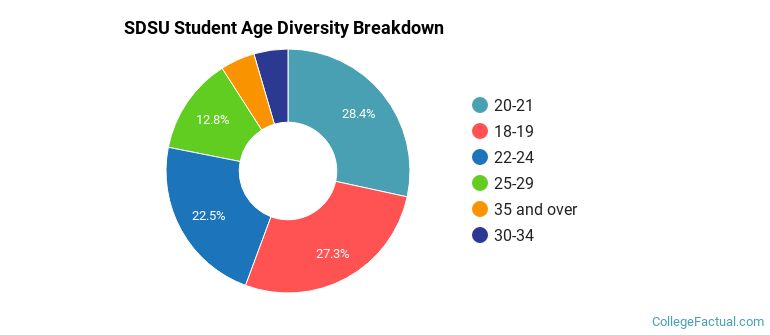
| Student Age Group | Amount |
|---|---|
| 20-21 | 9,878 |
| 18-19 | 9,479 |
| 22-24 | 7,810 |
| 25-29 | 4,454 |
| 35 and over | 1,590 |
| 30-34 | 1,570 |
| Under 18 | 0 |
Footnotes
*The racial-ethnic minorities count is calculated by taking the total number of students and subtracting white students, international students, and students whose race/ethnicity was unknown. This number is then divided by the total number of students at the school to obtain the racial-ethnic minorities percentage.
References
Department of Homeland Security Citizenship and Immigration Services
Image Credit: By Wikipedia User:Geographer under License