Here is an overview of this program at SFCM. You can study it at the Bachelor’s level, with graduate study also available. Its best result is a rank of #36 out of 40 schools (Bachelor’s level) by College Factual. Jump to any of the following sections:
College Factual ranks SFCM as a strong choice for music, ranked #369 out of 416 schools nationally.
| Ranking | Rank |
|---|---|
| Best Music Schools | 369 of 416 |
| Best Music Schools in California | 51 of 56 |
The following degree levels are offered in music at SFCM, along with how many graduates complete each level annually.
| Degree Level | Annual Graduates |
|---|---|
| Bachelor’s | 56 |
| Master’s | 64 |
| Graduate Certificate | 3 |
| Professional Certificate | 30 |
For the most recent IPEDS reporting year, San Francisco Conservatory of Music conferred 56 bachelor’s degrees in music.
SFCM is in the top 5% of the country for music at the bachelor’s level. In particular it placed #36 out of 40 schools by College Factual.
| Ranking | Rank |
|---|---|
| Best Music Bachelor’s Degree Schools in California | 36 |
| Best Music Bachelor’s Degree Schools in the Far Western US Region | 51 |
| Best Music Bachelor’s Degree Schools | 339 |
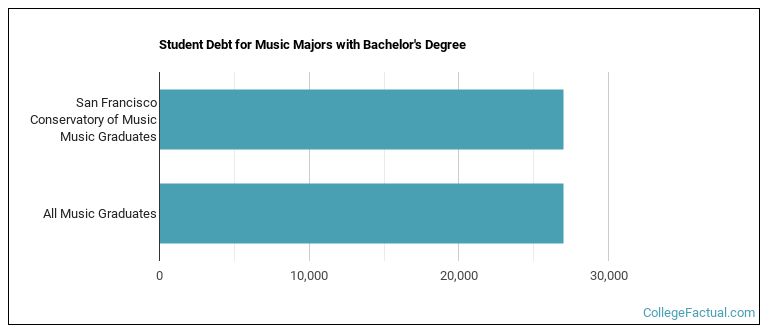
Music graduates with a bachelor’s degree from SFCM earn a median of $26,772 a year. This is higher than $26,432, the median for all majors at SFCM.
While getting their bachelor’s degree at SFCM, music students borrow a median amount of $27,000 in student loans. This is above $27,000, the typical median for all majors at SFCM.
Information about average full-time undergraduate tuition and fees is shown in the table below.
| In State | Out of State | |
|---|---|---|
| Tuition | $49,300 | $54,400 |
| Fees | $1,750 | $1,750 |
Read more about SFCM tuition and fees.
In the most recent graduating class, 66% of music bachelor’s degrees went to men and 34% went to women.
 The largest share of music bachelor’s degree graduates at SFCM were White. Roughly 38% of graduates fell into this category.
The following table and chart show the ethnic background for students who recently graduated from San Francisco Conservatory of Music with a bachelor’s in music.
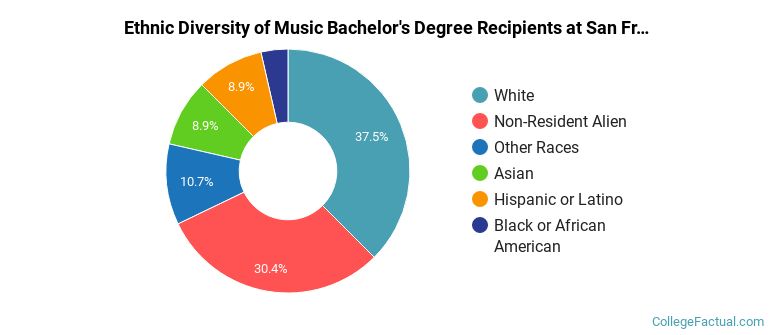
| Ethnic Background | Number of Students |
|---|---|
| Asian | 5 |
| Black or African American | 2 |
| Hispanic or Latino | 5 |
| White | 21 |
| Non-Resident Aliens | 17 |
| Other Races | 6 |
SFCM awarded 17 bachelor’s degrees in stringed instruments recently — 59% to women and 41% to men. The largest share of these graduates were White (29%).
SFCM awarded 11 bachelor’s completions in music technology recently — 18% to women and 82% to men. The most common background among these graduates was White (55%).
SFCM conferred 7 bachelor’s degrees in jazz/jazz studies recently — 14% to women and 86% to men. Most of these graduates identified as White (57%).
SFCM granted 6 bachelor’s degrees in keyboard instruments recently — 50% to women and 50% to men. The largest share of these graduates were Non-Resident Alien (83%).
SFCM awarded 5 bachelor’s completions in voice and opera in the latest year of data — 40% to women and 60% to men. The most common background among these graduates was White (40%).
SFCM granted 4 bachelor’s degrees in percussion instruments in the most recent reporting year — 0% to women and 100% to men. The largest share of these graduates were White (50%).
SFCM awarded 2 bachelor’s completions in brass instruments in the most recent reporting year — 0% to women and 100% to men. Most of these graduates identified as Hispanic or Latino (50%).
SFCM conferred 2 bachelor’s completions in music theory and composition in the latest year of data — 0% to women and 100% to men. Most of these graduates identified as Hispanic or Latino (50%).
SFCM awarded 2 bachelor’s degrees in woodwind instruments in the most recent reporting year — 50% to women and 50% to men. Most of these graduates identified as White (50%).
This program is also offered at the graduate level at SFCM. Annual graduate completions by level are shown below.
| Graduate Level | Annual Graduates |
|---|---|
| Master’s Degrees in Music | 64 |
| Graduate Certificate Degrees in Music | 3 |
| Professional Certificate Degrees in Music | 30 |
More about our data sources and methodologies.
