We've gathered data and other essential information about the program, such as the average salary of graduates, ethnicity of students, how many students graduated in recent times, and more. In addition, we cover how SFSU ranks in comparison to other schools with music programs.
Jump to any of the following sections:
Learn about start dates, transferring credits, availability of financial aid, and more by contacting the universities below.
Earn the music business degree that fits into the business world – and partners Southern New Hampshire University with world-renowned Berklee College of Music.
The bachelor's program at SFSU was ranked #238 on College Factual's Best Schools for music list. It is also ranked #26 in California.
| Ranking Type | Rank |
|---|---|
| Best Music Master’s Degree Schools | 125 |
| Best Music Graduate Degree Schools | 128 |
| Best Music Bachelor’s Degree Schools | 227 |
| Best Music Schools | 238 |
During the 2021-2022 academic year, San Francisco State University handed out 26 bachelor's degrees in music. This is an increase of 4% over the previous year when 25 degrees were handed out.
In 2022, 7 students received their master’s degree in music from SFSU. This makes it the #184 most popular school for music master’s degree candidates in the country.
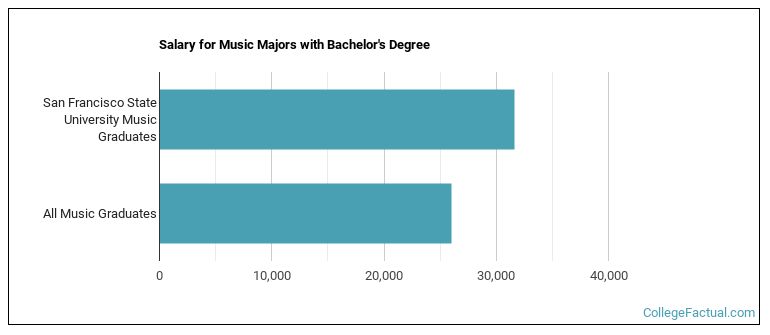
Music majors who earn their bachelor's degree from SFSU go on to jobs where they make a median salary of $31,621 a year. This is great news for graduates of the program, since this figure is higher than the national average of $26,036 for all music bachelor's degree recipients.
The following table shows the average full-time tuition and fees for undergraduates.
| In State | Out of State | |
|---|---|---|
| Tuition | $5,742 | $17,622 |
| Fees | $1,682 | $1,682 |
| Books and Supplies | $1,099 | $1,099 |
| On Campus Room and Board | $17,955 | $17,955 |
| On Campus Other Expenses | $3,978 | $3,978 |
Learn more about SFSU tuition and fees.
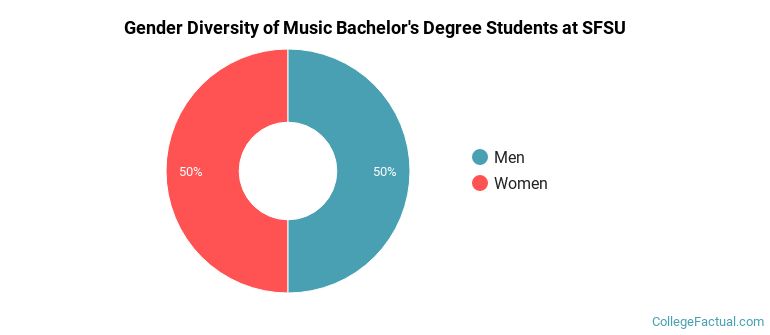
During the 2021-2022 academic year, 26 music majors earned their bachelor's degree from SFSU. Of these graduates, 50% were men and 50% were women.
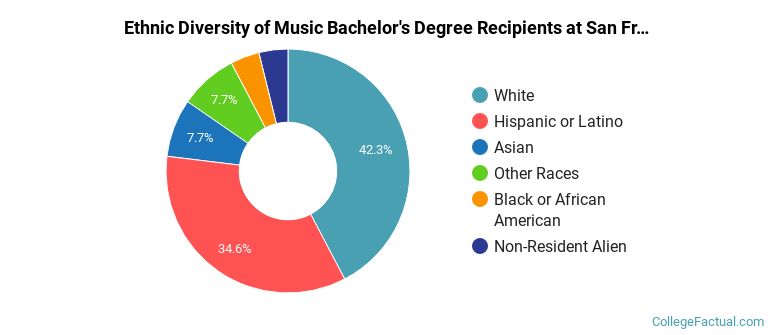
The following table and chart show the ethnic background for students who recently graduated from San Francisco State University with a bachelor's in music.
| Ethnic Background | Number of Students |
|---|---|
| Asian | 2 |
| Black or African American | 1 |
| Hispanic or Latino | 9 |
| White | 11 |
| Non-Resident Aliens | 1 |
| Other Races | 2 |
Online degrees for the SFSU music bachelor’s degree program are not available at this time. To see if the school offers distance learning options in other areas, visit the SFSU Online Learning page.
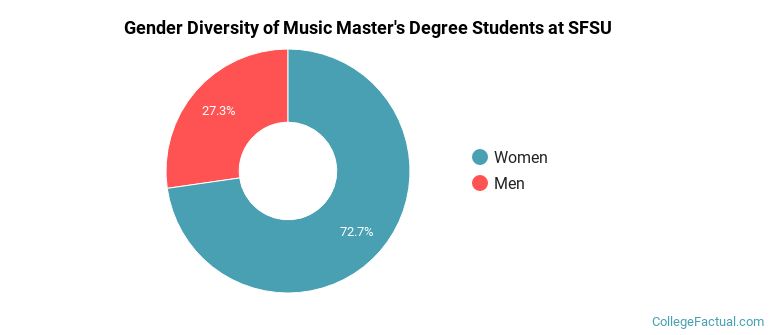
The music program at SFSU awarded 11 master's degrees in 2021-2022. About 27% of these degrees went to men with the other 73% going to women.
The following table and chart show the ethnic background for students who recently graduated from San Francisco State University with a master's in music.
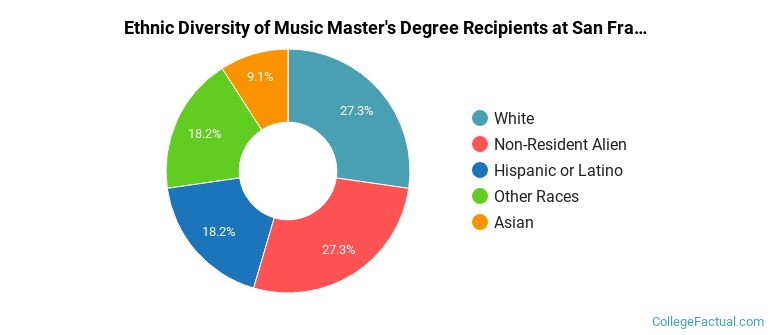
| Ethnic Background | Number of Students |
|---|---|
| Asian | 1 |
| Black or African American | 0 |
| Hispanic or Latino | 2 |
| White | 3 |
| Non-Resident Aliens | 3 |
| Other Races | 2 |
Take a look at the following statistics related to the make-up of the music majors at San Francisco State University.
| Related Major | Annual Graduates |
|---|---|
| Film, Video & Photographic Arts | 257 |
| Design & Applied Arts | 202 |
| Fine & Studio Arts | 115 |
| Drama & Theater Arts | 36 |
| Dance | 8 |
More about our data sources and methodologies.
