SFSU total enrollment is approximately 27,349 students. 19,847 are undergraduates and 2,172 are graduate students.
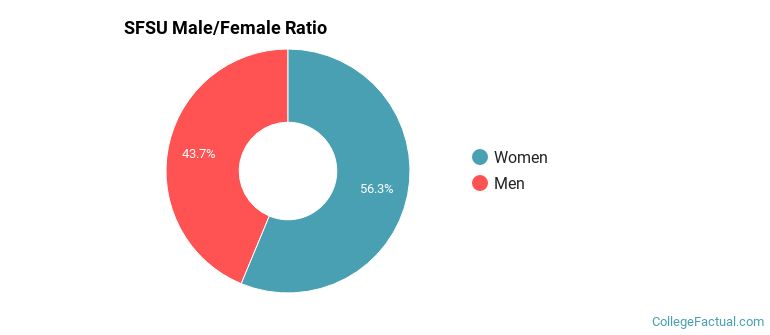
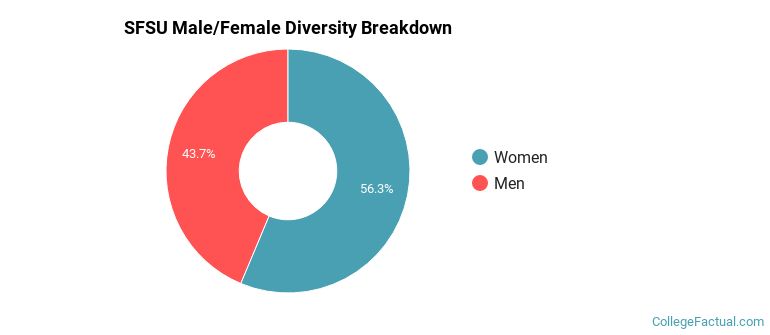
Male/Female Breakdown of Undergraduates
The full-time SFSU undergraduate population is made up of 57% women, and 43% men.
For the gender breakdown for all students, go here.
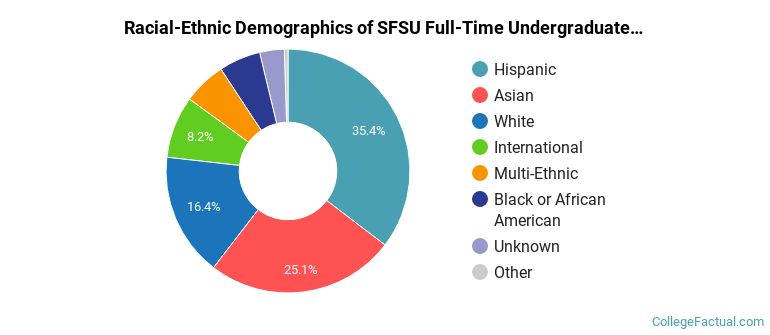
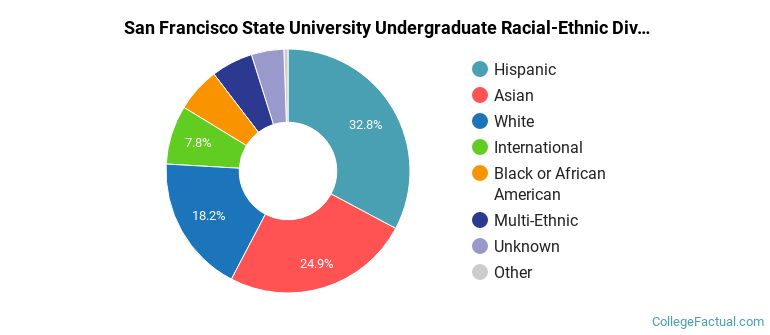
SFSU Racial/Ethnic Breakdown of Undergraduates
| Race/Ethnicity | Number |
|---|---|
| Hispanic | 7,287 |
| Asian | 5,109 |
| White | 3,007 |
| International | 1,390 |
| Black or African American | 1,173 |
| Multi-Ethnic | 1,095 |
| Unknown | 633 |
| Native Hawaiian or Pacific Islander | 118 |
See racial/ethnic breakdown for all students.
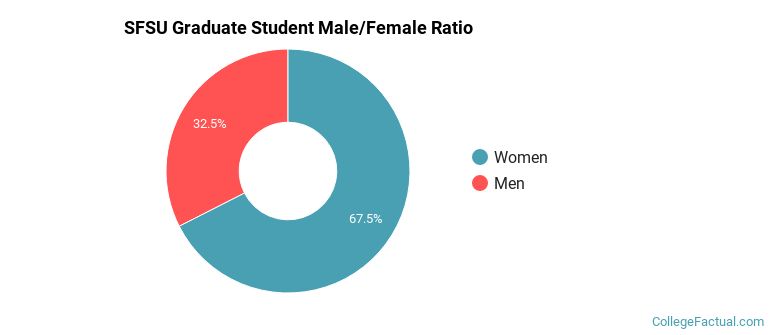
Male/Female Breakdown of Graduate Students
About 68% of full-time grad students are women, and 32% men.
For the gender breakdown for all students, go here.
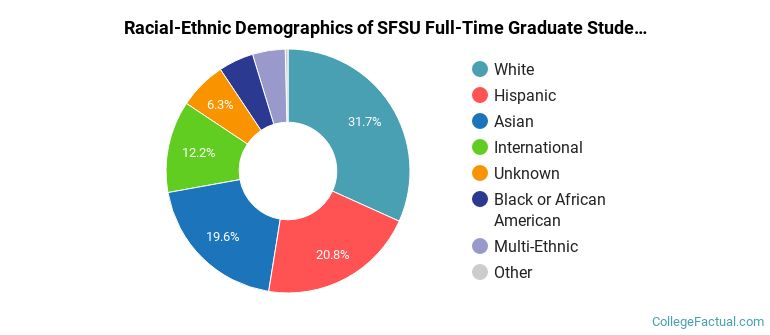
SFSU Racial-Ethnic Breakdown of Graduate Students
| Race/Ethnicity | Number |
|---|---|
| White | 643 |
| Hispanic | 494 |
| Asian | 451 |
| International | 231 |
| Unknown | 135 |
| Black or African American | 115 |
| Multi-Ethnic | 91 |
| Native Hawaiian or Pacific Islander | 7 |
See racial/ethnic breakdown for all students.
| Race/Ethnicity | Number |
|---|---|
| Hispanic | 9,195 |
| Asian | 6,789 |
| White | 4,737 |
| International | 1,871 |
| Black or African American | 1,573 |
| Unknown | 1,527 |
| Multi-Ethnic | 1,457 |
| Native Hawaiian or Pacific Islander | 153 |
There are approximately 15,491 female students and 11,858 male students at SFSU.
SFSU ranks 1,785 out of 2,183 when it comes to geographic diversity.
0.65% of SFSU students come from out of state, and 2.88% come from out of the country.
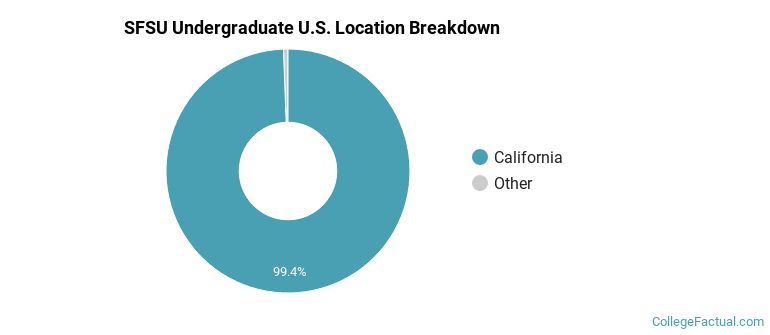
The undergraduate student body is split among 14 states (may include Washington D.C.). Click on the map for more detail.
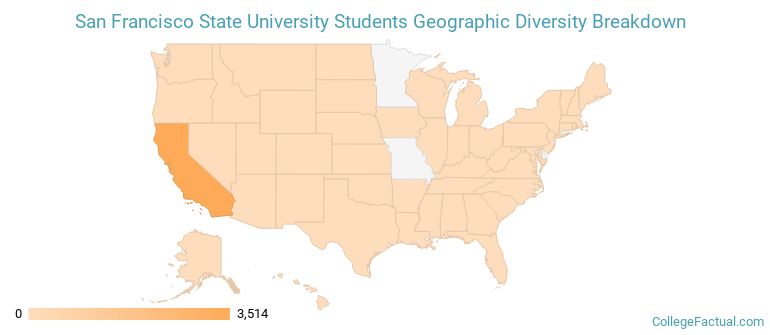
| State | Amount |
|---|---|
| California | 3,514 |
| Washington | 5 |
| Texas | 4 |
| Nevada | 2 |
| Arizona | 1 |
Students from 103 countries are represented at this school, with the majority of the international students coming from China, India, and Japan.
Learn more about international students at SFSU.
A traditional college student is defined as being between the ages of 18-21. At SFSU, 47.02% of students fall into that category, compared to the national average of 60%.
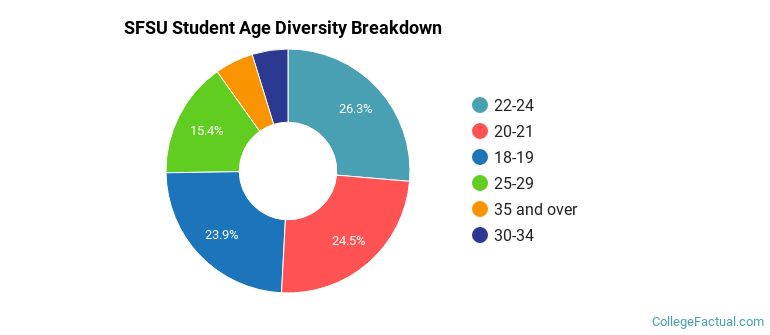
| Student Age Group | Amount |
|---|---|
| 22-24 | 7,613 |
| 20-21 | 7,079 |
| 18-19 | 6,912 |
| 25-29 | 4,438 |
| 35 and over | 1,479 |
| 30-34 | 1,374 |
| Under 18 | 0 |
Footnotes
*The racial-ethnic minorities count is calculated by taking the total number of students and subtracting white students, international students, and students whose race/ethnicity was unknown. This number is then divided by the total number of students at the school to obtain the racial-ethnic minorities percentage.
References
Department of Homeland Security Citizenship and Immigration Services
Image Credit: By Briantrejo under License
Find out how College Factual created their Diversity Rankings.